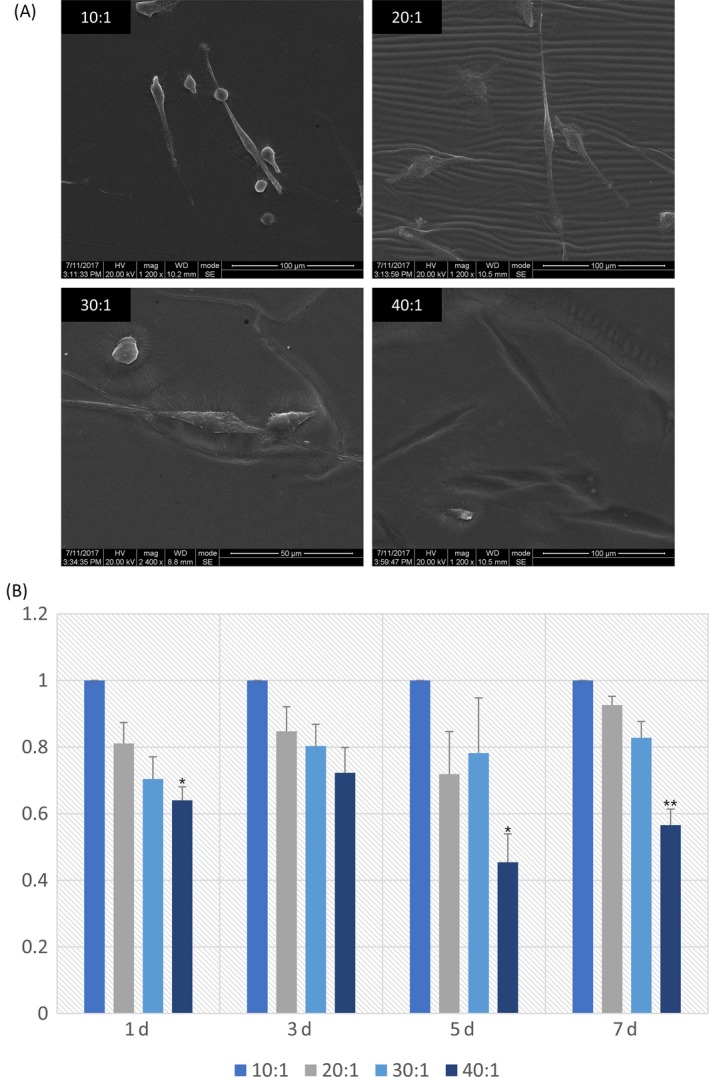
Figure 1.

A, SEM images of DPSCs cultured on varying elastic PDMS materials. Scale bars in 10:1, 20:1 are 100 μm, and in 30:1, 40:1 are 50 μm. B, CCK‐8 assay was carried out on the first, third, fifth and seventh day after seeding to detect the proliferation of DPSCs plated on various elasticity substrates. The results were calculated and represented by histogram. Data are normalized to that of group 10:1. The results shown are representative of 3 different samples (n = 5). Data are presented as mean ± SD. Statistical analysis: *P<.05,**P<.01, ***P<.001
