Figure 2.

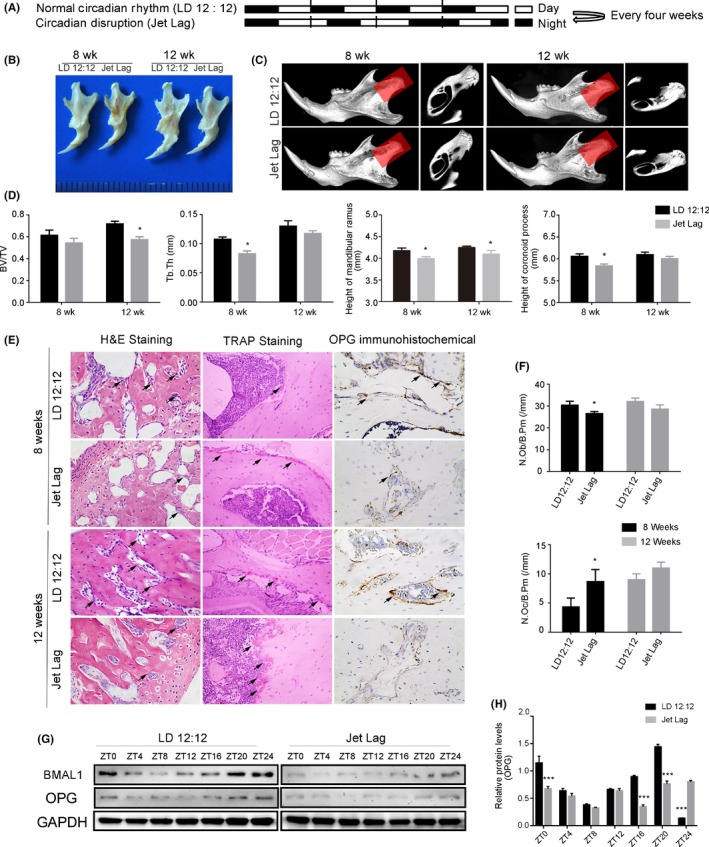
Circadian dysrhythmia contributes to skeletal mandibular hypoplasia and OPG expression decreased correspondingly. (A) A schematic depiction of C57 mice subjected to light/dark 12:12‐h (upper panel) and 6‐h light advanced every week for 4 or 8 wk (lower panel). (B) Photograph of mandibles dissected from 8‐ and 12‐wk‐old jet lag C57BL/6J or control mice. (C) Representative images of micro‐CT reconstructing the mandibles of 8‐ and 12‐week‐old mice in the normal or disrupted status. Shadow areas show cross‐sections of the condylar regions. (D) Micro‐CT reconstruction analysis of mandibles harvested from 8‐ to 12‐wk‐old mice in the normal or disrupted status (BV/TV, Tb.Th, height of the mandibular ramus, and height of the coronoid process) (n = 5 per group). (E) Representative images of H&E and TRAP staining and OPG immunohistochemistry from normal or jet lag mouse mandibles. The arrows indicate osteoblasts in the H&E staining images, and arrows indicate osteoclasts in the TRAP staining images. (magnification, 400x). (F) Osteoblast number (N.Ob/B.Pm), osteoclast number (N.Oc/B.Pm) were measured (n = 5 per group). (G) Western blot analysis of BMAL1 and OPG expression in mandibles from 12‐wk‐old jet lag C57BL/6J or control mice. N = 3 independent experiments. (H) Relative protein level of OPG in mandibles from 12‐wk‐old jet lag C57BL/6J or control mice. N = 3 independent experiments. BV/TV, bone volume/total volume; Tb.Th, trabecular thickness; N.Ob/B.Pm, number of osteoblasts/bone perimeter; N.Oc/B.Pm, number of osteoclasts/bone perimeter. Data represent the mean ± SD. *P < .05, **P < .01, ***P < .001. Two‐tailed Student's t test was used
