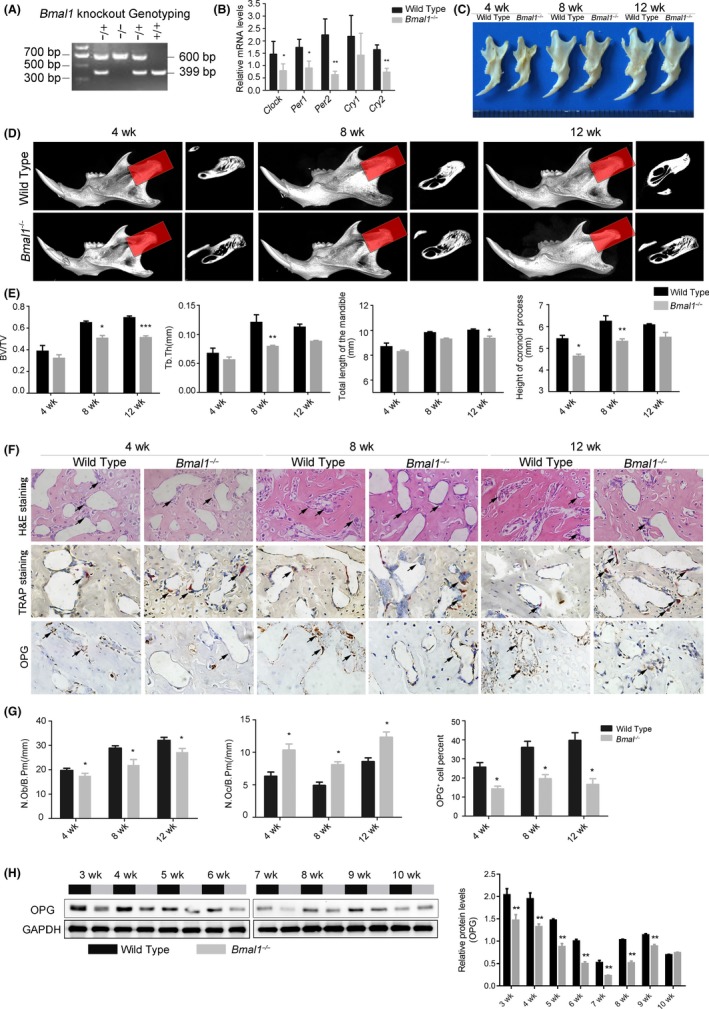
Figure 3.

Skeletal mandibular hypoplasia in Bmal1 −/− mice with decreasing OPG expression. (A) Genotype determined by PCR amplification in Bmal1 −/−, Bmal1 +/− , and Bmal1 +/+ mice (n = 5 per genotype). (B) mRNA levels of circadian clock genes Clock, Per1, Per2, Cry1, and Cry2 in wild‐type and Bmal1 −/− mice, as quantified by qRT‐PCR. (C) Photograph of mandibles dissected from 4‐, 8‐, and 12‐week‐old Bmal1 −/− or wild‐type mice. (D) Representative images of micro‐CT reconstructing the mandibles of 4‐, 8‐, and 12‐week‐old Bmal1 −/− or wild‐type mice. Shadow areas show cross‐sections of the condylar region. (E) Micro‐CT reconstruction analysis of mandibles harvested from 4‐, 8‐, and 12‐wk‐old Bmal1 −/− or wild‐type mice (BV/TV, Tb.Th, total length of the mandible, and height of the coronoid process) (n = 5 per group). (F) Representative H&E and TRAP staining and OPG immunohistochemistry images from wild‐type or Bmal1 −/−mice mandibles. The arrows indicate osteoblasts in the H&E staining images, and arrows indicate osteoclasts in the TRAP staining images. (magnification, 400x). (G) Osteoblast number (N.Ob/B.Pm), osteoclast number (N.Oc/B.Pm), and OPG expression level were measured (n = 5 per group). (H) Western blot analysis of OPG expression in the mandibles of 3‐, 4‐, 5‐, 6‐, 7‐, 8‐, 9‐, and 10‐week‐old Bmal1 −/− and wild‐type mice. Data represent the mean ± SD, *P < .05, **P < .01, ***P < .001, from Student's t test
