
Figure 6.
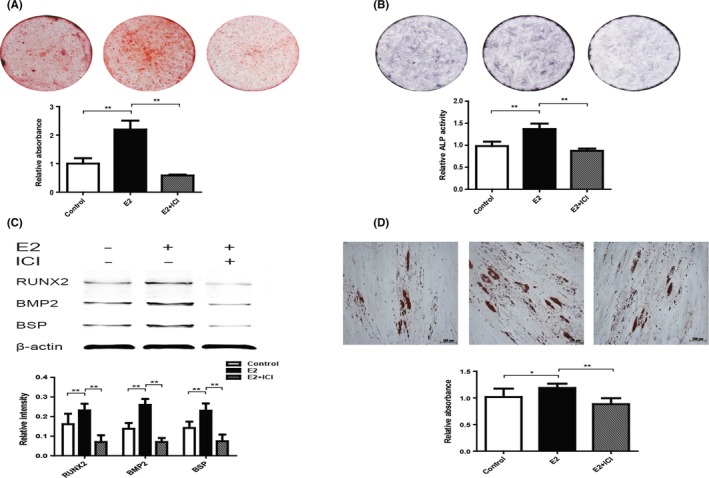
Oestrogen enhanced osteogenic and adipogenic differentiation of hPDLSCs in long‐term culture. The osteogenic differentiation capability of hPDLSCs was tested by Alizarin red staining and quantification (A). Alkaline phosphatase (ALP) staining and ALP activity results were shown in the graph (B). The expression of proteins (RUNX2, BMP2 and BSP) was detected by Western blotting, and the relative protein expression level was normalized to β‐actin (C). The adipogenic differentiation capability of hPDLSCs was tested by oil red O staining and quantification (D). RUNX2: Runt‐related transcription factor 2; BMP2: Bone morphogenic protein‐2; BSP: Bone sialoprotein. Data are shown as the mean ± SDs of 3 separate experiments. *P<.05; **P<.01