
Figure 7.
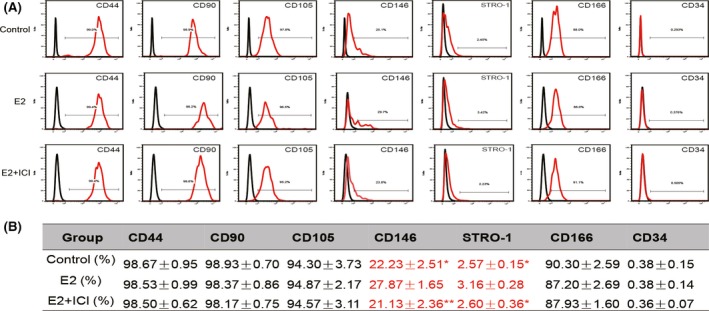
The effect of oestrogen on the surface markers of hPDLSCs during long‐term culture. The effect of oestrogen on the surface markers of hPDLSCs was tested by flow cytometry. Representative figures of cytometric flow tests (A). Percentage of positive expression (B). Data are shown as the mean ± SDs of 3 separate experiments. *P<.05 vs E2 group, **P<.01 vs E2 group