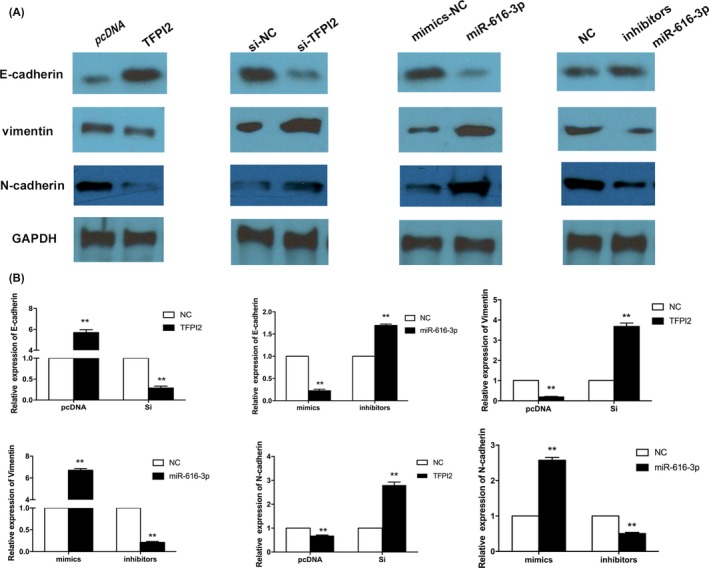
Figure 6.

Effects of miR‐616‐3p‐TFPI2 pathway on the EMT‐associated markers in vitro. A, Western blotting analysis of E‐cadherin, N‐cadherin and vimentin levels in HTR‐8/SVneo cells which transfected with miR‐616‐3p mimics, miR‐616‐3p inhibitors, tissue factor pathway inhibitor 2 (TFPI2) siRNAs and TFPI2 overexpression plasmid, respectively. B, Quantitative analysis of A. (values are mean ± SD, **P < .01.)
