
Figure 2.
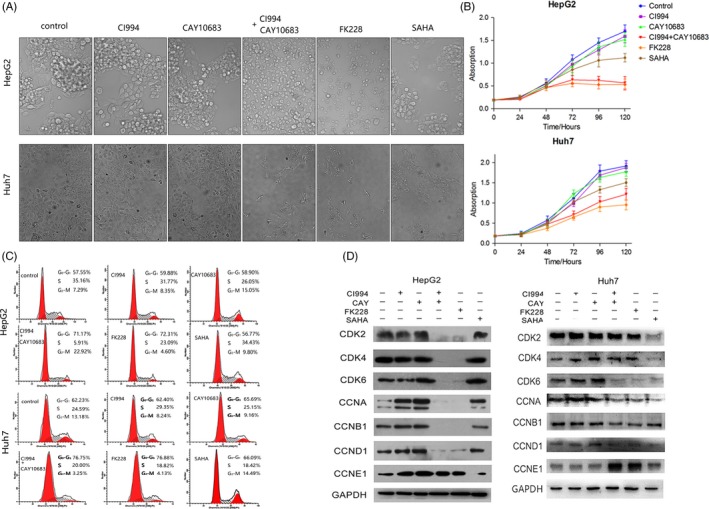
Effect of HDAC inhibitors on the morphology, growth and cell cycle distribution of HCC cells. The experimental groups were the Control, CI994, CAY10683, CI994+ CAY10683, FK228 and SAHA groups. (A) HepG2 and Huh7 cell morphology viewed under a microscope. (B) CCK‐8 staining of HepG2 and Huh7 cells treated with HDAC inhibitors. (C) Effect of HDAC inhibitors on HepG2 and Huh7 cell cycle distribution. (D) Effect of HDAC inhibitors on the expression of key cell cycle‐related proteins in HepG2 and Huh7 cells