
Figure 2.
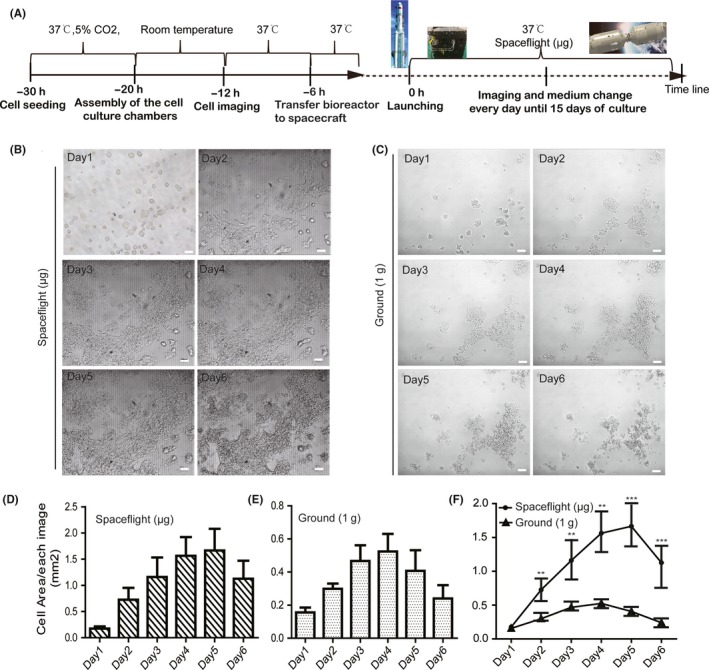
Comparison of mESCs growth in space microgravity and ground 1 g condition. A, Schematic illustration of procedure to load cells, install hardware and culture cells in the TZ‐1 spaceflight mission. Typical optical images showing the mESCs morphologies during 6 days of culture in spaceflight condition (B) or ground 1 × g condition (C). Scale bars = 100 μm. The growth areas of mESCs were measured for 3 typical images during 6 days of culture in spaceflight (D) and ground 1 × g condition (E). The results showed a notable increase in cell proliferation in a time‐dependent manner when cultured in spaceflight μg compared with 1 g ground condition (F). All results are shown as mean ± SD of with 3 independent images, with significance indicated by **P < .01 vs ground, ***P < .001 vs ground