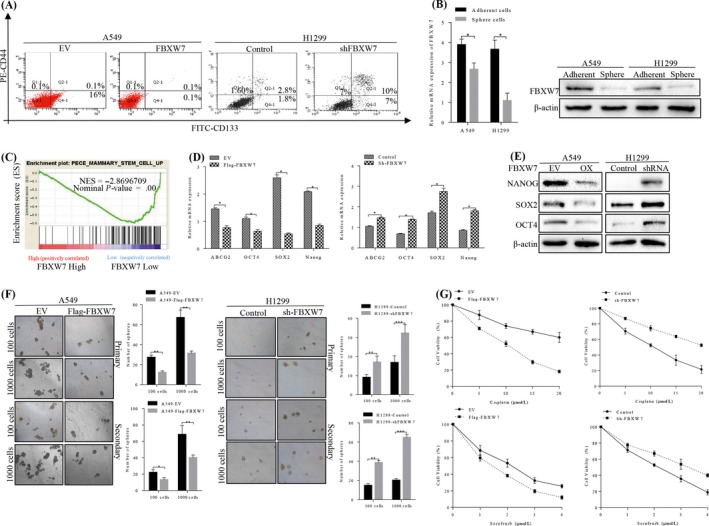
Figure 3.

Effect of FBXW7 on CSC and chemo‐resistance in NSCLC cells. A, Representative FACS profiles of A549 cell transduced with Flag‐FBXW7 or empty control vector and H1299 cell transduced with sh‐FBXW7 or control. Quantification of CSC and non‐CSC populations stained with CD44‐PE and CD133‐FITC. B, qRT‐PCR and immunoblot showing decreased FBXW7 expression in NSCLC cells spheres relative to adherent cells (*P < .05). D‐E, Real‐time PCR (D) and western blot analysis (E) of CSC‐associated markers in the indicated cells (*P < .05). F, Representative images of spheres formed by FBXW7‐knockdown H1299 cells and FBXW7‐overexpressing A549 cells. Number of spheres per well was quantified on primary spheroid formation assay and secondary spheroid formation assay for the two stable cells (**P < .05, *** P < .01 vs controls by T test). G, The sensitivity of FBXW7‐knockdown H1299 cells and FBXW7‐overexpressing A549 cells to cisplatin and sorafenib were determined by MTT, respectively. n = 3 repeats with similar results. Values are depicted as Mean ± SD
