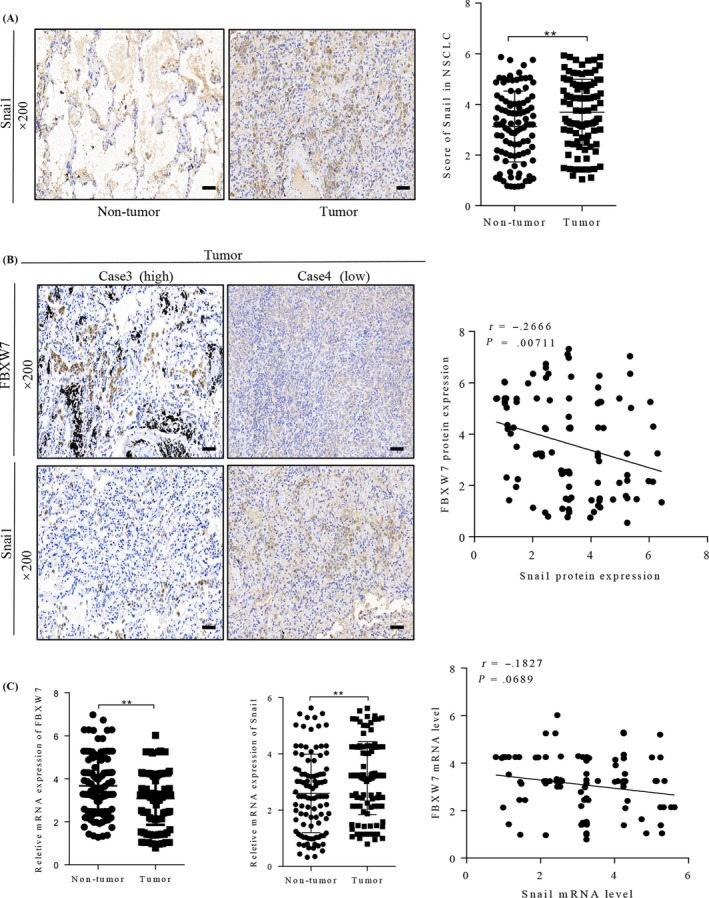
Figure 4.

Relationship between the expression of FBXW7 and Snai1 in NSCLC tissues. A, Immunohistochemical (IHC) staining for Snai1 in normal tumour adjacent tissues and NSCLC tissues (left panel). Corresponding semiquantifcation of Snai1 expression was shown in right panel (**P < .01). B, Representive staining of FBXW7 and Snai1 in two NSCLC samples (left panel). Linear regression analyses of IHC scores between FBXW7 and Snai1 in NSCLC tissues (r = −.2666, P = .00711). Case3 represent FBXW7 high expression sample, Case 4 represent FBXW7 low expression sample. C, The mRNA level of Snai1 and FBXW7 were detected in NSCLC tissues and matched normal tumour adjacent tissues, qRT‐PCR assay (left and middle panel, ** P < .01). Linear regression analyses of mRNA level between FBXW7 and Snai1 in NSCLC tissues (right, r = −.1827, P = .0689)
