Figure 5.

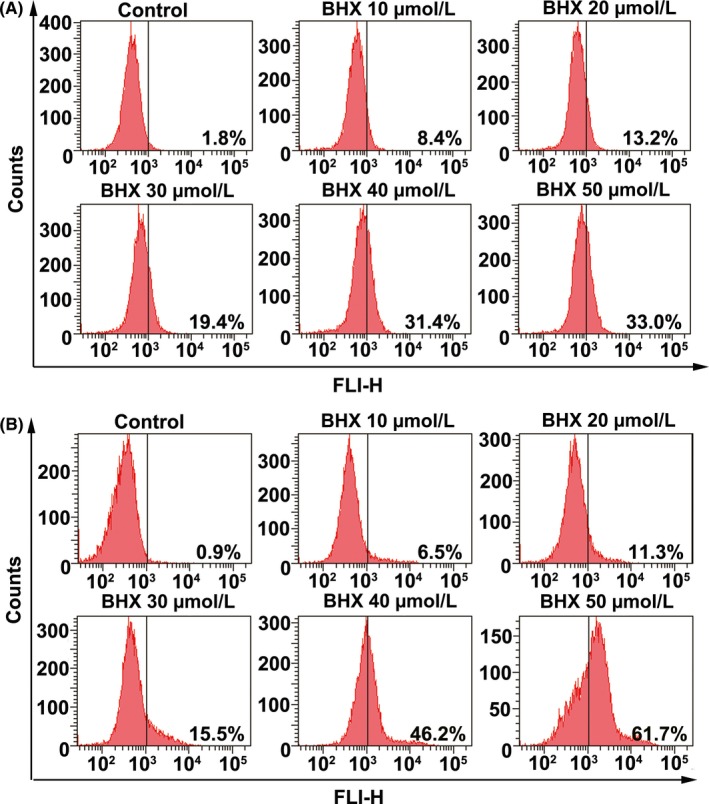
BHX induced intracellular ROS generation (A) and elevation of intracellular calcium (B) in K562 cells. The cells were treated with different concentrations of BHX for 24 h. Flow cytometry analysis was used to detect the intracellular ROS level by staining with DCFH‐DA (A) and the intracellular calcium was detected by probing with Fluo‐3 (B)
