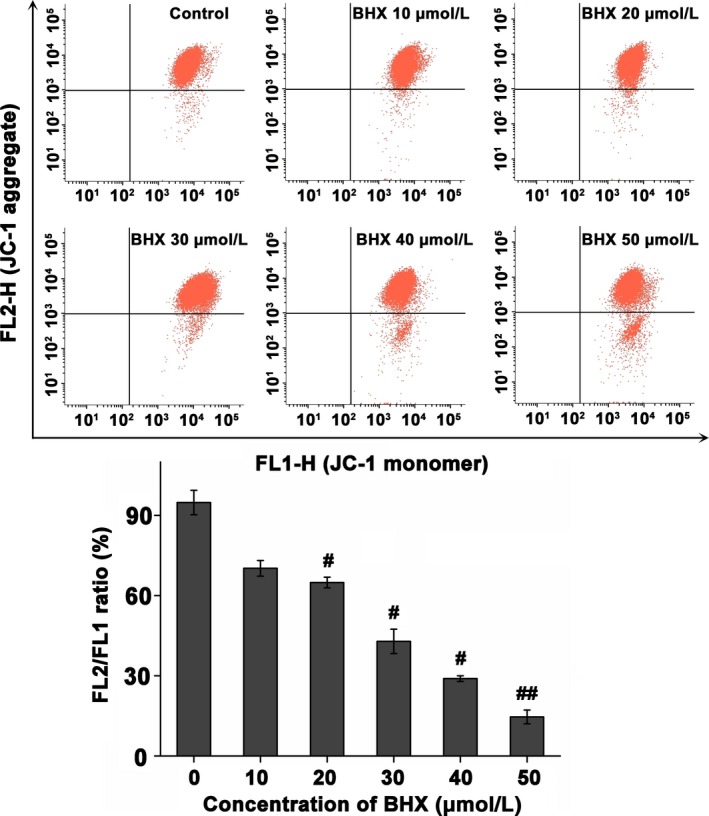
Figure 6.

Dissipation of mitochondrial membrane potentials in K562 cells following incubation with varied concentrations of BHX for 24 h. Treated cells were harvested, stained with JC‐1, and assayed by flow cytometry. The histogram illustrates the ratio of FL2/FL1. Each assay was repeated in triplicate; data were expressed as mean ± SD #P < .05 and ##P < .01 compared with the control group
