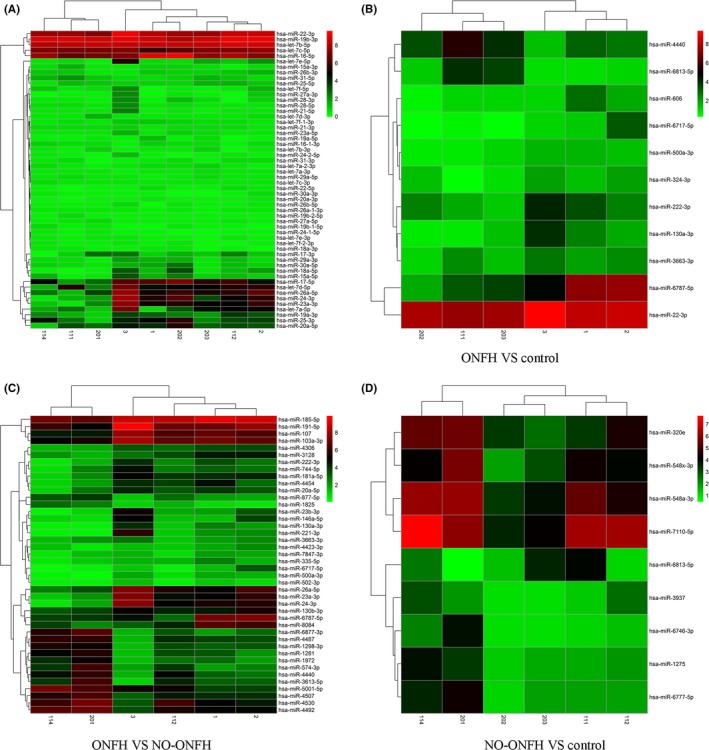
Figure 1.

Differentially abundant miRNAs in serums of SLE‐ONFH patients. A, A heatmap representation of all differentially abundant miRNAs is shown. B, A heatmap of differentially abundant miRNAs between the SLE‐ONFH group and healthy control group. C, A heatmap of differentially abundant miRNAs between SLE‐ONFH group and the SLE control group. D, The heatmap of differentially abundant miRNAs between the SLE and healthy control groups was shown. 1, 2 and 3 denote samples in the SLE‐ONFH group; 112, 114 and 201 denote samples in the SLE control group; 111, 202 and 203 denote healthy control samples
