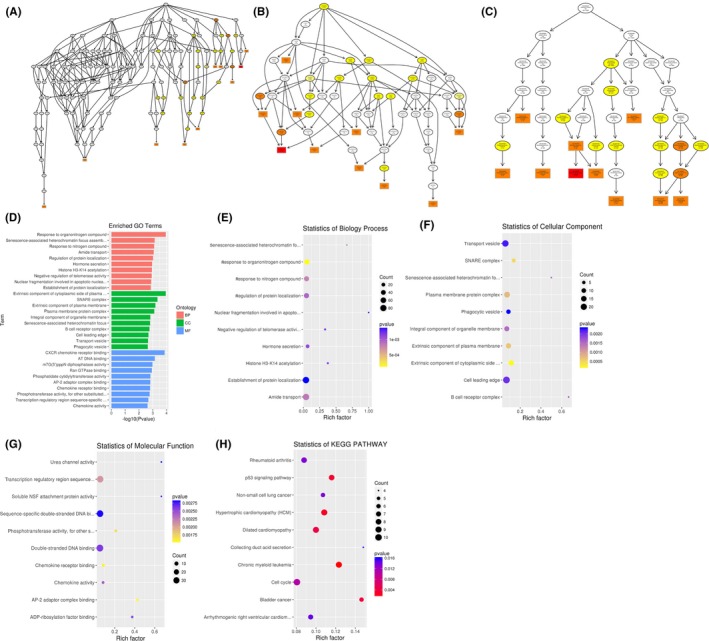
Figure 3.

Functional predictions of differentially abundant miRNAs in SLE‐ONFH vs healthy control. A‐C, Molecular functions, biological processes and cellular components were predicted to be altered by mRNAs targeted by differentially abundant miRNAs in ONFH. Directed Acyclic Graph (DAG) is the graphical display of GO enrichment results with candidate target genes. D, The number of genes in GO term was shown in histograph. E‐G, Enriched biological processes, cellular components and molecular functions in ONFH were shown. H, Scatterplot of enriched KEGG pathway showing statistics of pathway enrichment in ONFH
