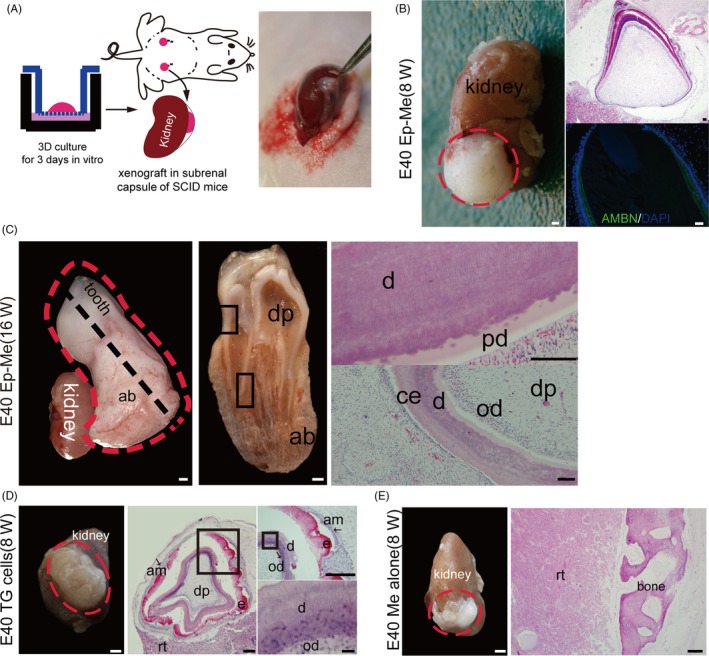
Figure 4.

In vivo development of re‐aggregated Ep‐Me cells from tooth germs at cap stage in mouse subrenal capsule. (A), Schematic diagram of the ectopic transplantation of bioengineered tooth germs into a mouse subrenal capsule after culturing for 3 d in vitro. (B), The re‐associated explants with epithelial and mesenchymal cell compartmentalization (E40 Ep‐Me) restore the de novo odontogenesis at 8 wk post‐transplantation. Left panel: macro view of regenerated tissues (red dotted line). Right panels: histological analysis (H&E staining) and immunostaining of the ameloblast‐specific marker ameloblastin (AMBN, green). (C), The re‐associated explants with epithelial and mesenchymal cell compartmentalization (E40 Ep‐Me) developed into a tooth after transplantation for 16 wk in the subrenal capsule, Left panel: macro view. Red dotted line indicates the tooth and supporting tissues. Middle panel: cross view of profile of tooth and supporting tissues at the black dotted cut line in the left panel. Right panels: histological analysis (H&E stain) corresponding to boxed areas in middle panel. (D), Re‐aggregation of mixed tooth epithelial and mesenchymal cells (TG cells) regenerated tooth crown structures by self‐sorting of epithelial and mesenchymal cells at 8 wk post‐transplantation. Left panel: macro view of regenerated tissues (red dotted line). Middle and right panels: histological analysis (H&E stain). (E), Re‐aggregation of mesenchymal cells alone (Me cells) formed bone tissue at 8 wk post‐transplantation. ab, alveolar bone; am, ameloblast; b, bone; d, dentin; dp, dental pulp; e, enamel; od, odontoblast; rt, renal tissue. Scale bars: gross view, 1 mm; histology, 100 μm
