
Figure 2.
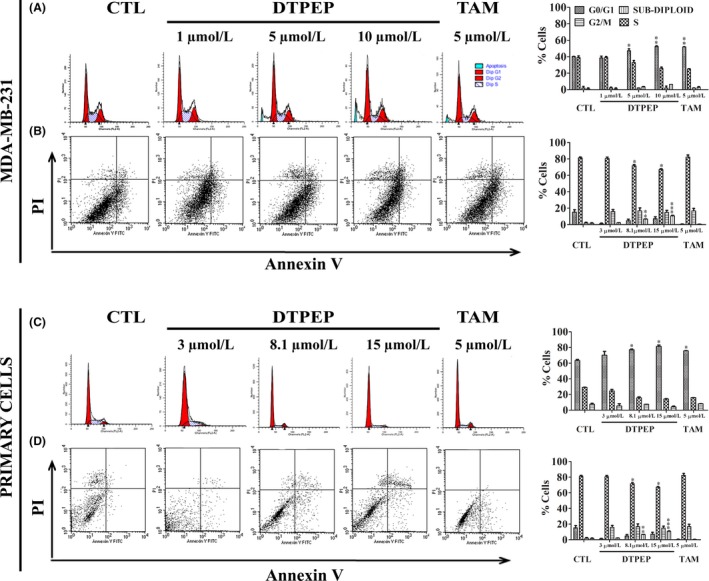
Effect of DTPEP and TAM in cell cycle and apoptosis of breast cancer cell, MDA‐MB‐231 (A, B) and primary cells (C, D). (A, C). For cell cycle PI‐stained cells, number and cell size were counted using flow cytometry. After gating out cell debris and aggregates, 5000‐10 000 events were collected for analysis of each sample. The percentage of cells in different phases of cell cycle was calculated based on their PI stained DNA content vs cell size. (B, D). The per cent cells undergoing apoptosis was determined using Annexin V‐FITC & PI double staining assay and flow cytometry (FACS Calibur, Becton‐Dickinson, San Jose, CA, USA). After gating out cell debris and aggregates, 10 000 events were collected for analysis of each sample. All values are expressed as mean with their standard errors (mean ± SEM, N = 3) derived from three independent cytometry assay and presented with histograms on corresponding right side panels. Statistical analysis of each parameter for the compound treated groups was compared with non‐treated groups using one‐way ANOVA (non‐parametric) with Newman‐Keuls post hoc test. The difference was considered statistically significant if *P < .05. **P < .01 and ***P < .001 vs control