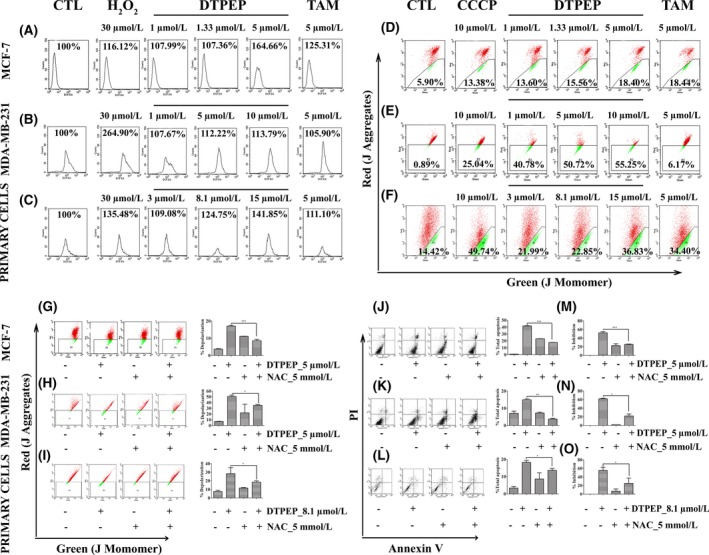
Figure 3.

DTPEP induced ROS generation, mitochondrial depolarization and ROS‐dependent mitochondrial depolarization and apoptosis in breast cancer cells. (A‐C) DTPEP induced ROS generation in breast cancer cells, (A) MCF‐7 cells, (B) MDA‐MB‐231 and (C) primary cells. H2O2 was used as a positive control to induce cellular ROS. After gating out cell debris, 10 000 events were collected for analysis of each sample. All values of ROS are expressed as percentage of ROS generation derived from CellQuest software‐based analysis of acquired cytometric data. (D‐F). DTPEP induced mitochondrial depolarization in breast cancer cells, (D) MCF‐7 cells, (E) MDA‐MB‐231 and (F) primary cells. 10 μmol/L CCCP was used as positive control to induce mitochondrial depolarization and added 2 h before harvesting of cells for flow cytometric analysis. After gating out cell debris, 10 000 events were collected for analysis of each sample. Data of mitochondrial depolarization are expressed as % gated population of monomeric JC‐1 with green fluorescence indicative of low ΔΨm and aggregates JC‐1 with red fluorescence indicative of high ΔΨm derived from cytometry (FACS Calibur, Becton‐Dickinson, San Jose, CA, USA). (G‐I) DTPEP induced ROS‐dependent mitochondrial depolarization of breast cancer cells (G) MCF‐7 cells, (H) MDA‐MB‐231 and (I) primary cells. (J‐L). DTPEP induced ROS‐dependent apoptosis determined by Annexin V‐FITC & PI double staining assay using flow cytometry in breast cancer cells, (J) MCF‐7 cells, (K) MDA‐MB‐231 and (L) primary cells. After gating out cell debris, 10 000 events were collected for analysis of each sample. Data are expressed as % total apoptotic population by combining lower right (early apoptotic) and upper right (late apoptotic) quadrant data of flow cytogram (M‐O). DTPEP‐induced ROS‐dependent loss of percentage inhibition was determined with MTT assay of breast cancer cells (M) MCF‐7 cells, (N) MDA‐MB‐231 and (O) primary cells. Data are expressed as % cell inhibition compared to control. In all the assays, 5 mM of NAC was used as a standard ROS scavenger. Statistical analysis of each parameter of DTPEP treated in the presence of NAC groups was compared with DTPEP alone treated groups using one‐way ANOVA (non‐parametric) with Newman‐Keuls post hoc test. The difference was considered statistically significant if *P < .05, **P < .01 and ***P < .001 DTPEP in the presence of NAC vs DTPEP alone treated group
