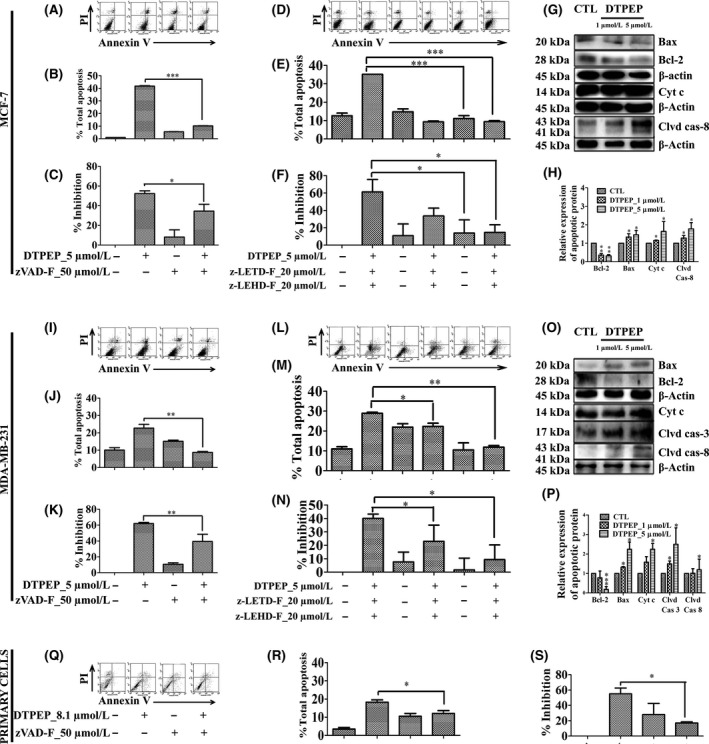
Figure 4.

DTPEP‐induced caspase‐dependent apoptosis determined by Annexin V‐FITC & PI double staining assay using flow cytometry and loss of percentage inhibition was determined with MTT assay of breast cancer cells (A‐F) MCF‐7 cells, (I‐N) MDA‐MB‐231 and (Q‐S) primary cells. Here, 50 μmol/L of z‐VAD‐FMK (pan‐caspase inhibitor), 20 μmol/L of z‐LETD‐FMK (caspase‐8 inhibitor) and 20 μmol/L of z‐LEHD‐FMK (caspase‐9 inhibitor) were used. Statistical analysis of each parameter of DTPEP treated in the presence of z‐VAD‐FMK, z‐LETD‐FMK and z‐LEHD‐FMK groups was compared with DTPEP alone treated groups using one‐way ANOVA (non‐parametric) with Newman‐Keuls post hoc test. The difference was considered statistically significant if *P < .05, **P < .01, and ***P < .001 DTPEP in the presence of z‐VAD‐FMK, z‐LETD‐FMK and z‐LEHD‐FMK vs DTPEP alone treated group. DTPEP induced mediator of both extrinsic and intrinsic apoptosis pathway in breast cancer cells (G,H) MCF‐7 cells, and (O,P) MDA‐MB‐231. Each experiment was repeated three times and quantitation of band intensity was performed by densitometry (H & P) using Quantity One® software (v.4.5.1). Statistical analysis of each parameter for the compound treated groups was compared with non‐treated groups using one‐way ANOVA (non‐parametric) with Newman‐Keuls post hoc test. The difference was considered statistically significant if *P < .05. **P < .01 and ***P < .001 vs control. Primary antibodies used Bax (cat. 2772, cst), Bcl‐2 (cat. 2876, cst), Cleaved Caspase‐8 (cat. 9496, cst), Cleaved Caspase‐3 (cat. 9661, cst), Cytochrome c (cat. 4272, cst) and β‐actin (cat. 4970, cst)
