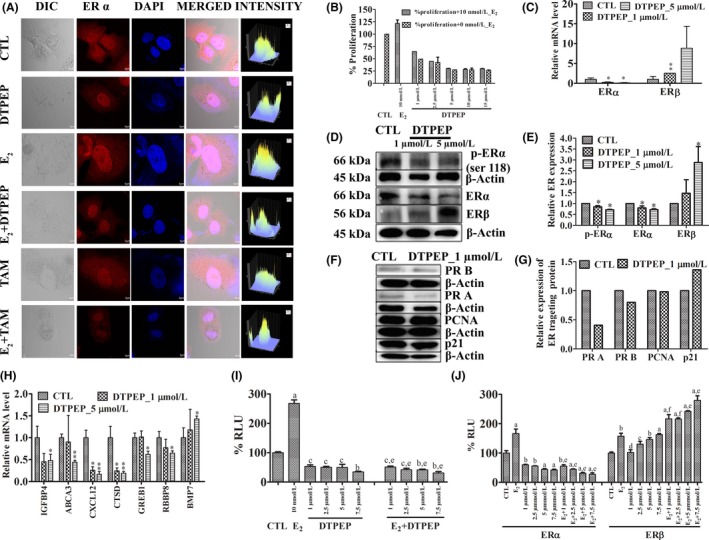
Figure 5.

(A) DTPEP and tamoxifen downregulates ERα protein expression in MCF‐7 cells irrespective of E2 presence. ERα was detected with fluorophore‐tagged secondary antibody and counter‐staining done with DAPI. Microphotograph, 40× magnification were acquired with confocal microscope (FLUOVIEW FV1200 Multi Photon Laser Scanning Microscope,). Immunofluorescence correlating with ERα protein expression was quantitated by using software FV10‐ASW Ver.4.1,FV1200, Olympus showed on the right column. (B) DTPEP inhibits E2‐induced proliferation of MCF‐7 cells. MCF‐7 cells were treated in different concentration of DTPEP with or without 10 nmol/L E2 in phenol red free DMEM media with 0.5% of charcoal striped FBS for 24 h and results were determined by MTT assay. DTPEP on downregulates ERα and upregulates ERβ in MCF‐7 cells. (C) Relative mRNA level of ERα and ERβ. (D) ER status of MCF‐7 cells with western blot, (E) Densitometry of western blot of ER status. Effect of DTPEP on ER‐targeting/responsive/dependent protein (F) evaluated by western blot, its densitometry (G) and genes (H) expression determined by real‐time PCR. Statistical analysis of each parameter for the compound treated groups was compared with non‐treated groups using one‐way ANOVA (non‐parametric) with Newman‐Keuls post hoc test. The difference was considered statistically significant if *P < .05 and **P < .01 vs control. DTPEP modulates classical (ERE‐mediated) transcriptional activation. (I) Transcriptional activation of the ERE promoter by total ER in MCF‐7 and (J) by transiently transfected ERα and ERβ in MDA‐MB231 in response to compound either alone or in the presence of 10 nmol/L E2 for agonistic and antagonistic activity. MCF‐7 cells were transfected with ERE‐luc reporter plasmid and MDA‐MB‐231 cells were cotransfected with ERα or ERβ expression vector along with pERE‐luciferase reporter plasmid and incubated with various concentrations of compound for 24 h. Renilla luciferase pRL‐luc plasmid was used for internal control. Results are described as % of normalized relative luciferase unit (RLU). Results are expressed as mean ± SEM, n = 3. P values are a—P < .001, b—P < .01, c—P < .05 and d—P > .05 vs control and e—P < .001, f—P < .01, g—P < .05 and h—P > .05 vs E2 . Primary antibodies used Phospho‐Oestrogen Receptor α (Ser118) (cat. 251, cst), p21 (cat. 2947, cst), ERα (MC‐20) (cat.sc‐542) and ERβ (cat.sc‐8974), PR, (cat.sc‐528), PCNA (cat.sc‐53407) and β‐actin (cat. 4970, cst)
