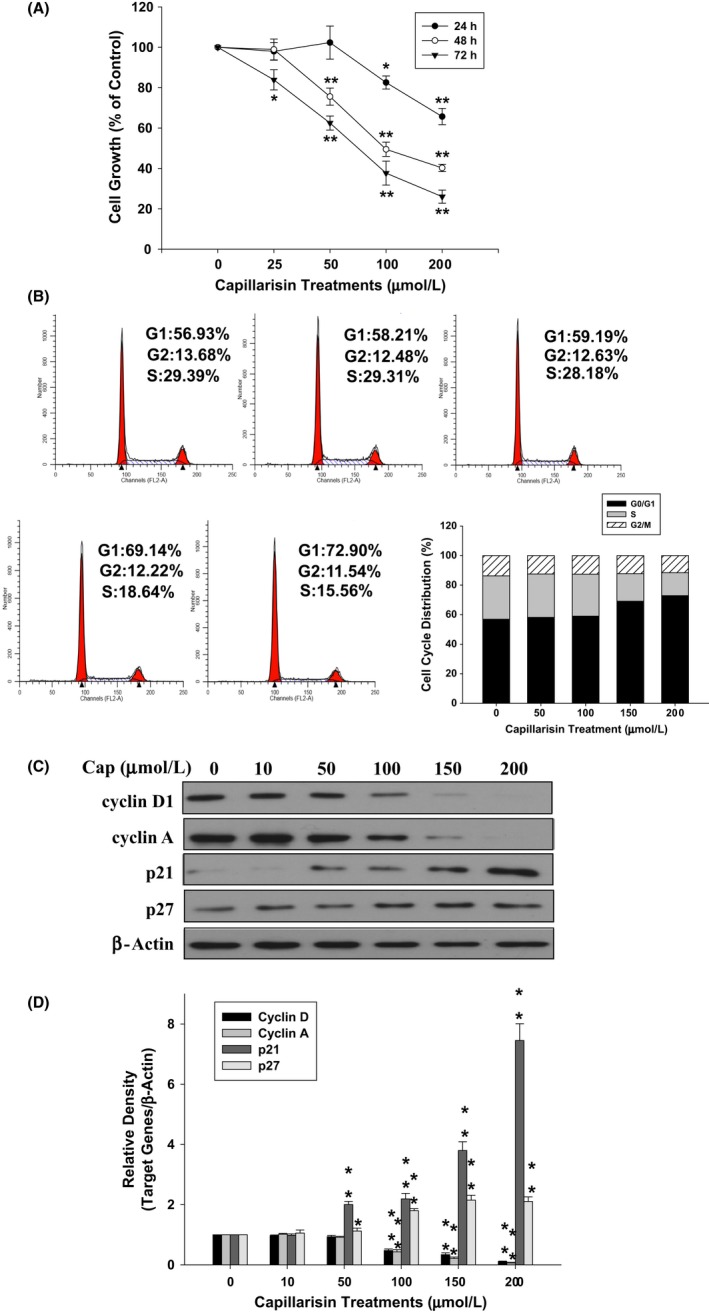
Figure 4.

Capillarisin (Cap) modulation of growth and distribution of LNCaP cells. (A) Cells were treated with various concentrations of Cap at indicated time periods, and cell growth was determined by water‐soluble tetrazolium‐1 (WST‐1) assays. Cell growth of the vehicle‐treated group is set as 100% and data obtained from three independent experiments are expressed as mean ± SE. (B) The cell cycle distribution of LNCaP cells after cells were treated with various concentrations of Cap as indicated for 24 hours. (C) Cells were treated with various concentrations of Cap as indicated for 24 hours. Expression of cyclin D1, cyclin A, p21, and p27 was determined by immunoblotting assays. (D) The fold‐induction data are expressed as the intensity of the protein bands produced from the target gene/β‐actin (±SE; n = 3) relative to that of the vehicle‐treated group
