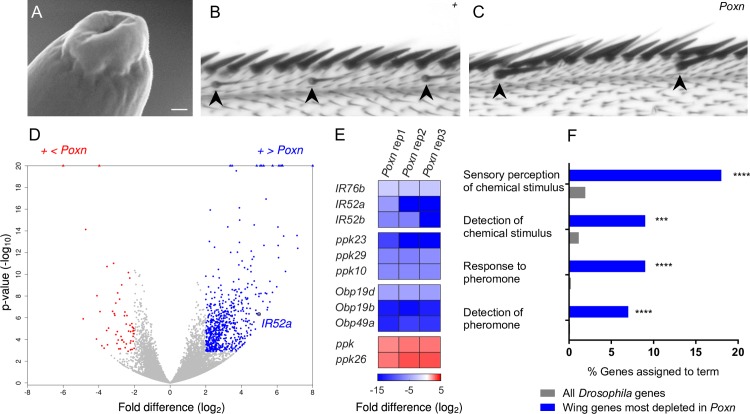
Fig 1. Taste sensilla in the wing and RNA-seq screen of control and Poxn wings.
(A) Scanning electron microscope image of the tip of a chemosensory hair on the wing. Scale bar = 50 nm. (B) Anterior wing margin of a control wing (w Canton-S). Thin, curved chemosensory sensilla are indicated by arrowheads. (C) Anterior wing margin of Poxn. Chemosensory sensilla are missing; rather, sensilla that appear larger than their neighbors are observed (arrowheads). The larger sensilla may be mechanosensory. (D) Volcano plot of genes showing their relative transcript levels in Poxn and control wings. The x-axis indicates the log2 fold difference of FPKM for each gene. The y-axis indicates the P value of the difference. Blue dots indicate genes that are expressed at levels more than 4-fold higher in control than in Poxn and for which the difference is significant at P < 0.01 (adjusted P < 0.01, DESeq2 Wald test). Red dots indicate genes that are expressed at levels more than 4-fold higher in Poxn. Points at top of graph represent genes for which P values are extremely small. (E) Genes from the IR, Ppk, and Obp genes that show the most significant enrichment or depletion within their respective families. Color indicates log2 fold difference. (F) Gene ontology enrichment analysis of the top 100 genes that had more than a 4-fold increase in control as determined by P value. ***FDR < 0.001; ****FDR < 0.0001, PANTHER Overrepresentation Test. FDR, false discovery rate; FPKM, fragments per kilobase of transcript per million mapped reads; IR, ionotropic receptor.

