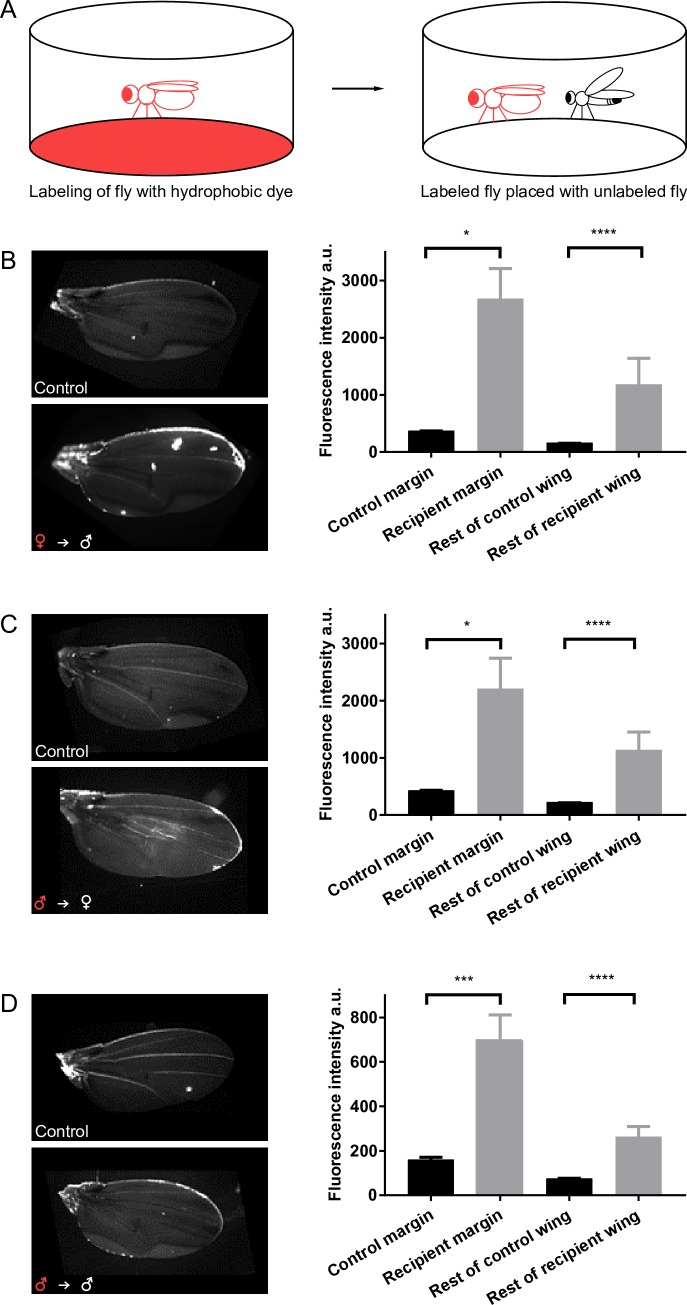
Fig 3. The wing receives compounds from another fly.
(A) Diagram of dye transfer experiments. For simplicity, a single labeled fly is shown; in the experiments, five flies were labeled together, and five flies were placed with a single unlabeled fly. (B–D) Left: wings from a control fly and from a fly that has been in a chamber with a labeled fly. Right: fluorescence intensity in control and recipient flies. (B) Unlabeled males after being placed with labeled females, n = 17. (C) Unlabeled females after being placed with labeled males, n = 20. (D) Unlabeled males after being placed with labeled males. The y-axis in this panel is on a different scale from the other panels, n = 14–16. *P < 0.05; ***P < 0.001; ****P < 0.0001, Kruskal–Wallis test, Dunn's multiple comparisons test. Underlying data for this figure can be found in S1 Data.

