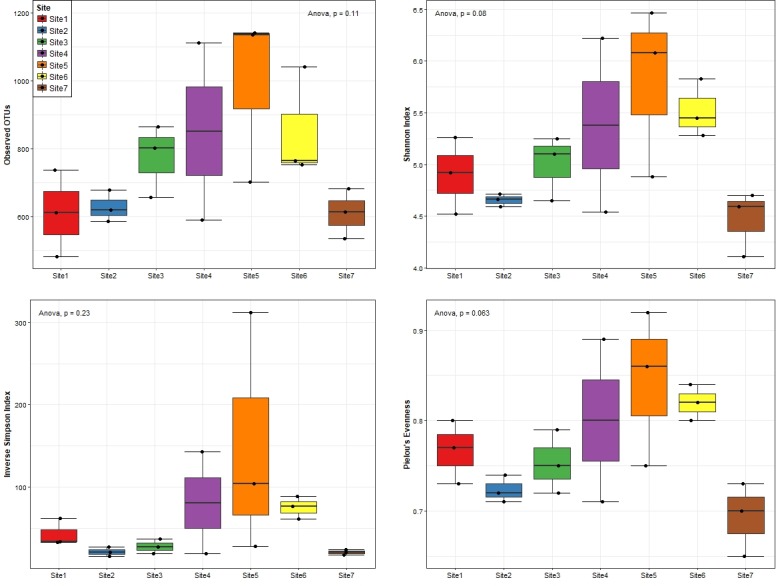
Fig 3. Alpha diversity indices grouped per sampling location.

Analyses were performed using the 97% identity level OTU table rarefied to 3774 sequences per sample. The samples are grouped and coloured coded by location interval.

Analyses were performed using the 97% identity level OTU table rarefied to 3774 sequences per sample. The samples are grouped and coloured coded by location interval.