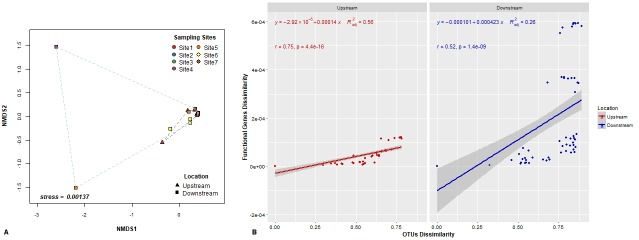
Fig 7.
Bray-Curtis dissimilarities of (A) the relative abundance of functional genes predicted by PICRUSt using NMDS analysis and (B) Mantel tests showing the relationship between the functional genes and OTU dissimilarities. Red dots and line denote upstream sites. Blue dots and line denote downstream sites. Pearson correlation coefficient (r), statistical significance (p) and adjusted R-squared (R2adj) of linear regression are indicated. Grey lines indicate 95% confidence intervals.

