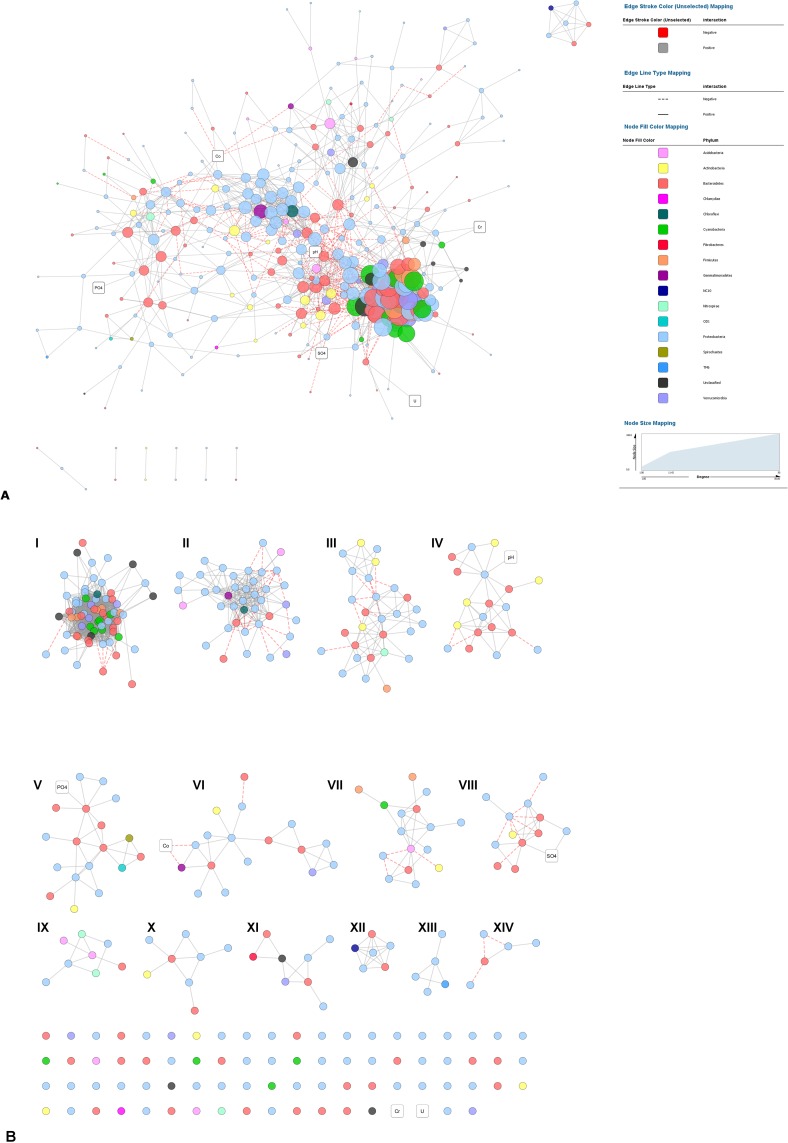
Fig 8. Network analysis of bacterial core OTUs (i.e. OTUs with relative abundance >0.2%) and environmental parameters.
Co-occurrence patterns were based on significant (P<0.05) Spearman correlations with ρ ≥ ±0.6 showing either (A) the entire network or (B) modules of MCODE clustering of the complete network with default parameters. Modules are numbered from I-XIV. Each node (circle) in the network, representing a unique OTU, is coloured by phylum and the size is proportional to node degree. Each edge (connection) represents a strong and significant correlation (P<0.05), while the colour relates to the type of interaction: positive (grey solid lines) or negative (red dashed lines). Environmental parameters are presented by white rectangles.

