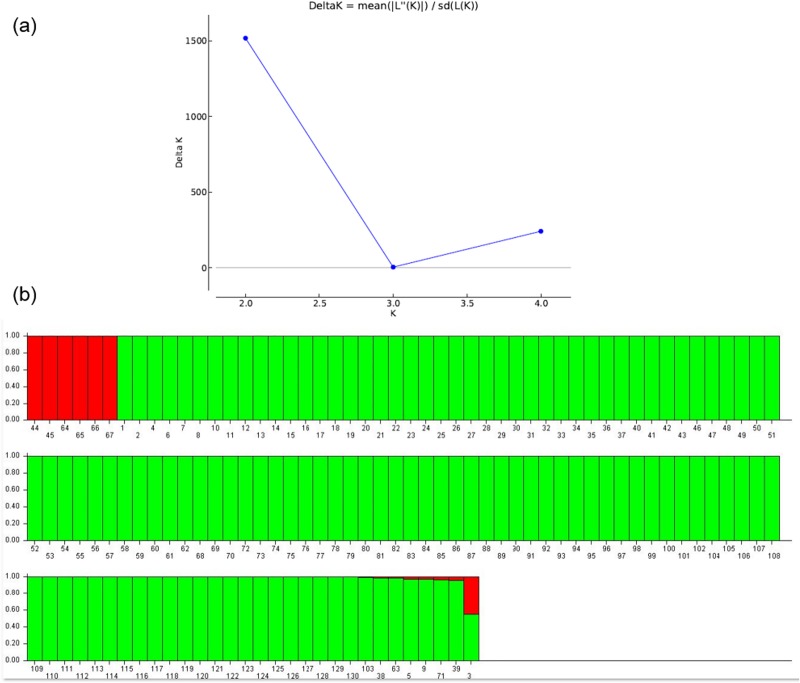
Fig 3. Population structure of 139 Capsicum germplasms.
(a) STRUCTURE estimation of the number of subgroups from K values ranging from 1 to 10, by delta K (ΔK) values. (b) Population structure from K = 2. The two colors each represent one subpopulation (red, C1; green, C2), and the lengths of the colored segments shows the estimated membership proportion of each germplasm in the designated group.

