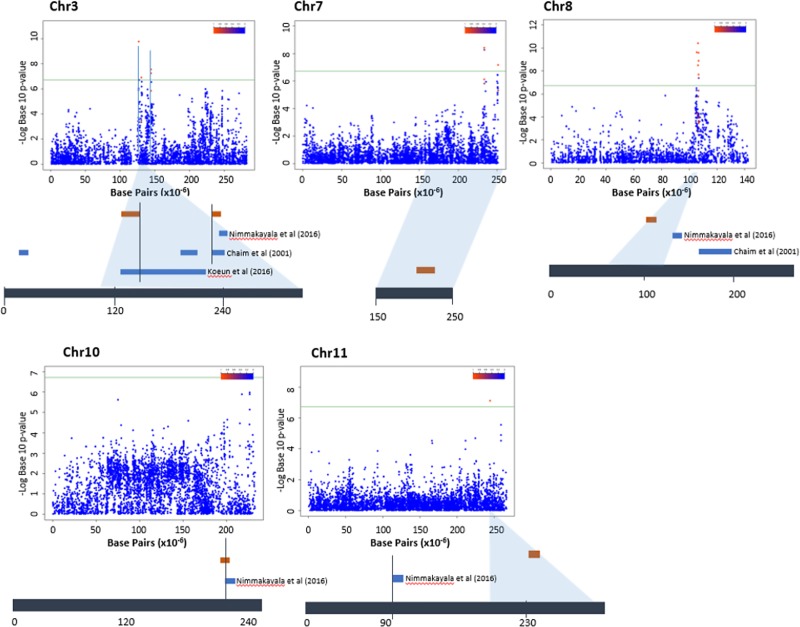
Fig 5. Manhattan plots of the genome-wide association study for fruit weight.
Chromosome coordinates are displayed along the X axis with the–log10 of the association P value for each single nucleotide polymorphism displayed on the Y axis. A greater–log10 indicates stronger association with the trait. The green line denotes the significance threshold. The threshold for–log10(P) was 6.0. Blue thick horizontal bars denote QTL positions reported previously, while brown horizontal thick bars are our results.

