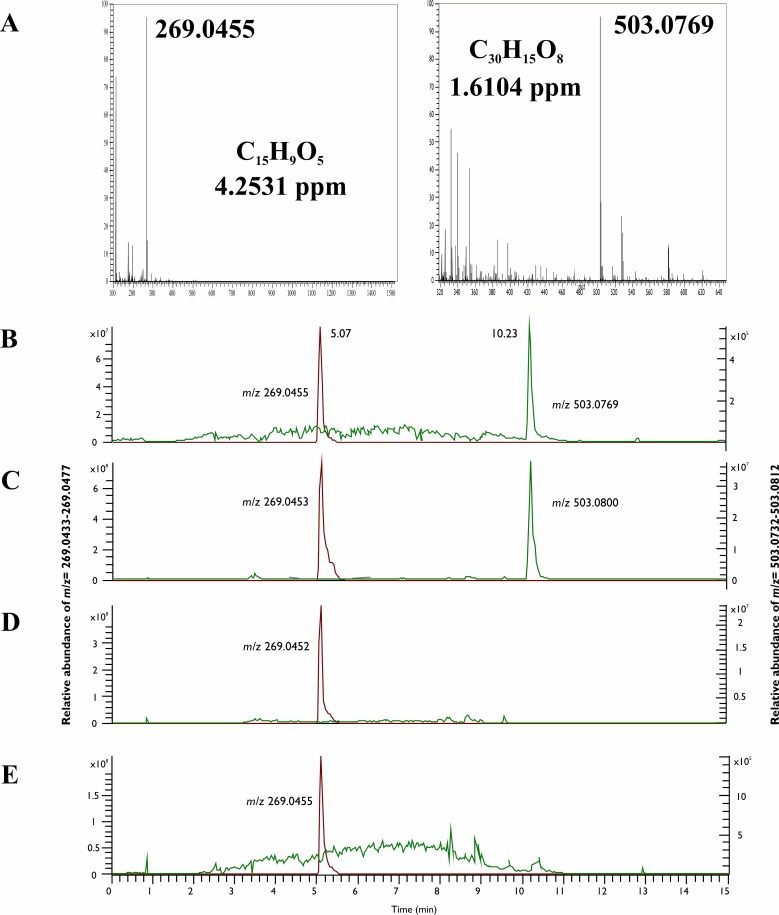
Fig 3. Full scan MS examinations of the hypericin and emodin production of the endophytes.
The full scan MS spectra of emodin (C15H9O5) and hypericin (C30H15O8) (A) and chromatograms of the standard hypericin and emodin (B), as well as the mycelial extract of SZMC 23769 (C), SZMC 23771 (D) and SZMC 23772 (E) extracted at the m/z values of hypericin (m/z 503.0732–503.0812) and emodin (m/z 269.0433–269.0477).

