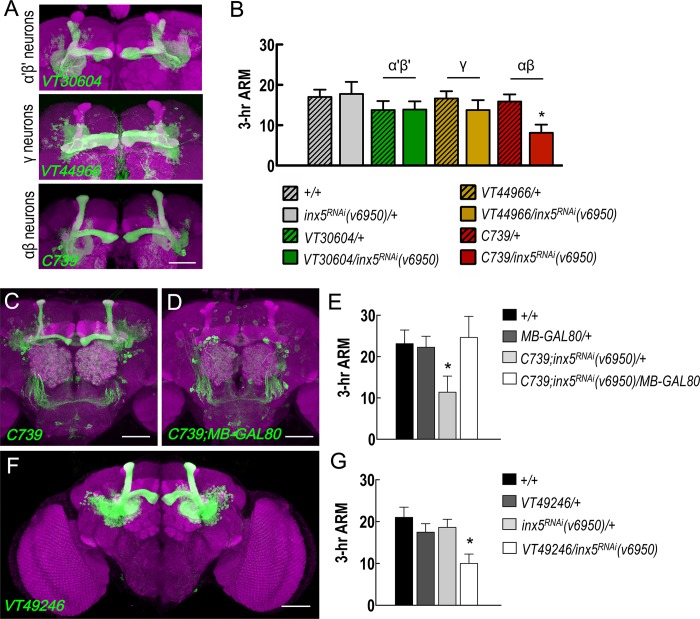
Fig 3. INX5 specifically acts on αβ neurons during ARM formation.
(A) Expression patterns (green) of VT30604-GAL4 (α′β′ neurons), VT44966-GAL4 (γ neurons), and C739-GAL4 (αβ neurons). The brain structures were counterstained with a DLG antibody (magenta). The scale bars represent 50 μm. (B) VT30604-GAL4, VT44966-GAL4, and C739-GAL4 were used to drive UAS-inx5RNAi expression in MB α′β′, γ, or αβ neurons, respectively. The 3-hour ARM values for these flies, including controls, are shown. Each value represents the mean ± SEM (n = 8). *, p < 0.05; one-way analysis of variance (ANOVA) followed by Tukey’s test. The genotypes were as follows: (1) +/+; +/+, (2) +/+; UAS-inx5RNAi(v6950)/+, (3) +/+; VT30604-GAL4/+, (4) +/+; VT30604-GAL4/UAS-inx5RNAi(v6950), (5) +/+; VT44966-GAL4/+, (6) +/+; VT44966-GAL4/UAS-inx5RNAi(v6950), (7) C739-GAL4/+; +/+, and (8) C739-GAL4/+; +/UAS-inx5RNAi(v6950). (C) The expression pattern of C739-GAL4-driven GFP expression in the central brain. The brain structures were counterstained with a DLG antibody (magenta). The scale bar represents 50 μm. (D) C739-GAL4-driven GFP expression in αβ neurons was reduced using the MB-GAL80 transgene. The brain structures were counterstained with a DLG antibody (magenta). The scale bar represents 50 μm. (E) ARM defect in the C739;inx5RNAi(v6950)/+ flies was rescued by removing the expression of GAL4 in αβ neurons using the MB-GAL80 transgene. Each value represents the mean ± SEM (n = 8) *, p < 0.05; ANOVA followed by Tukey’s test. The genotypes were as follows: (1) +/+; +/+, (2) MB-GAL80/+; +/+, (3) C739-GAL4/+; UAS-inx5RNAi(v6950)/+, and (4) C739-GAL4/MB-GAL80; +/UAS-inx5RNAi(v6950). (F) Expression pattern of VT49246-GAL4 (αβ neurons). The brain structures were counterstained with a DLG antibody (magenta). The scale bars represent 50 μm. (G) VT49246-GAL4 was used to drive UAS-inx5RNAi(v6950) to confirm the requirement for INX5 in MB αβ neurons for 3-hour ARM formation. Each value represents the mean ± SEM (n = 13–14). *, p < 0.05; ANOVA followed by Tukey’s test. The genotypes were as follows: (1) +/+; +/+, (2) +/+; VT49246-GAL4/+, (3) +/+; UAS-inx5RNAi(v6950)/+, and (4) +/+; VT49246-GAL4/UAS-inx5RNAi(v6950).

