Figure 1.

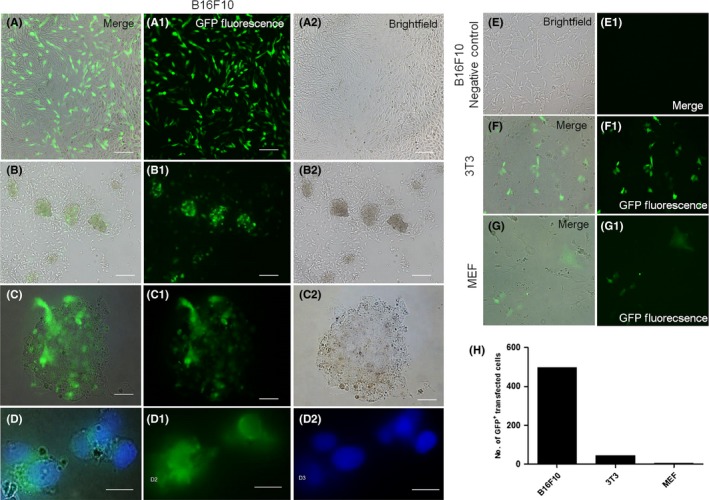
Transfection assay. Light microscopy and fluorescent imaging of the B16F10 cell line transfection procedures. A‐A2, GFP + cells highlighted in green fluorescence 18 h after the transfection. B‐B2, It is possible to see GFP + colonies formation 72 h after de transfection. C‐C2, iPSC‐like colony morphology, in which not all cells are GFP +. D‐D2, GFP + in the cell nucleus. E‐E1, Negative control of B16F10 for GFP −. Comparison of transfection efficiency between the B16F10 cells and fibroblasts (F and G) 18 h after the transfection, showing the GFP + cells. In (H), a comparative bar graph of the number of GFP + transfected cells from the B16F10, 3T3 and MEF, calculated by Wimasis Software
