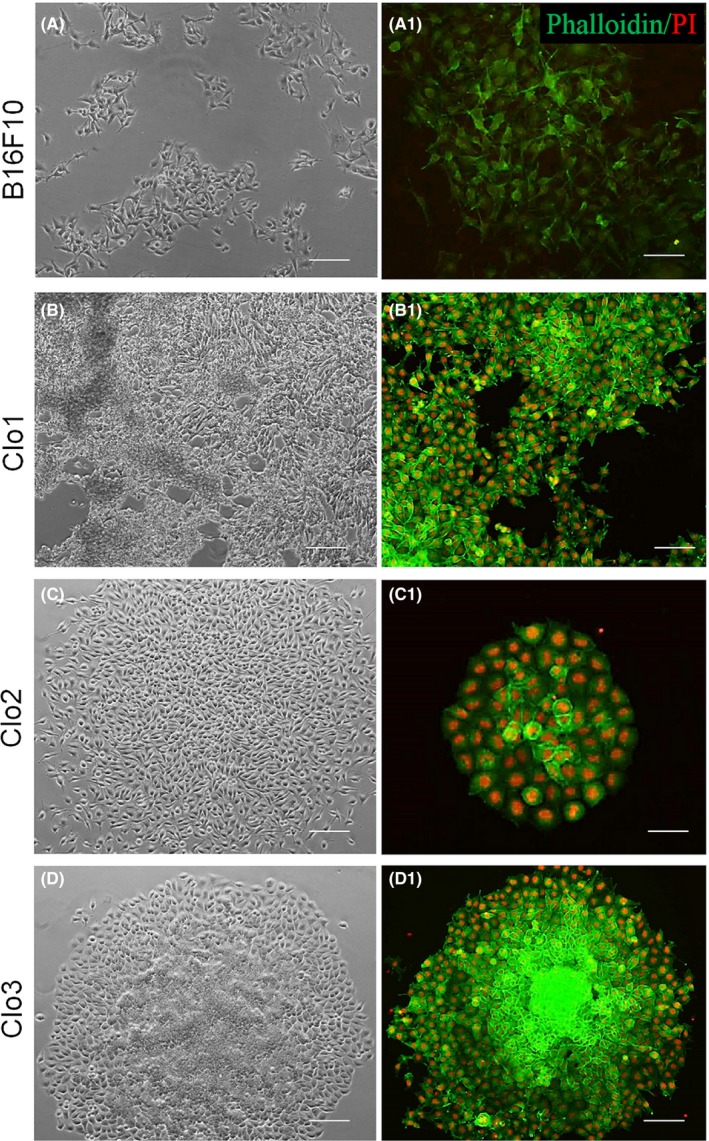
Figure 3.

Isolated clones morphology. Light microscopy and fluorescent imaging of the clones, with the parental B16F10 cells in (A‐D). Phalloidin stain highlights differences in the cytoskeleton morphology (A1‐D1). The colonies of Clo1 (B‐B1) are composed by separate cells, resembling parental B16F10 (A‐A1). Meanwhile, the Clo2 (C‐C1) and Clo3 (D‐D1) colonies are juxtaposed, being similar to pluripotent cells colonies
