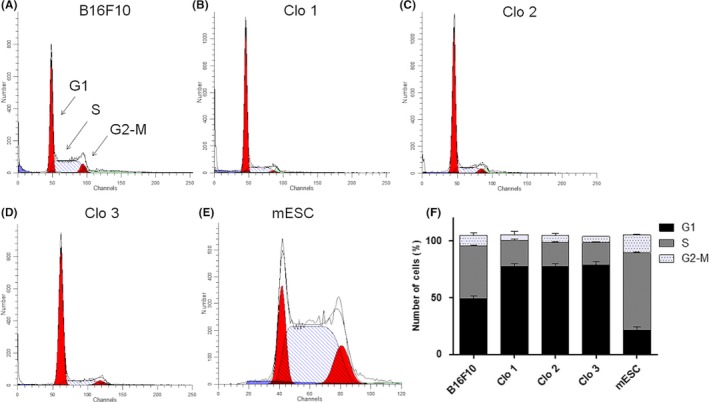
Figure 6.

Cell cycle analysis. (A‐E) Histograms of cell cycle of control cells and MMRC, F representative graph for comparison of the cell cycle phases of MMRC and respective controls. B16F10 parental cell line showed accumulation of cells in S phase (A, F), while MMRC demonstrated a high number of cells in G1 phase, besides the reduction of cell number in S phase (B‐D, F). mESC were used as control and shows high number of cells in S phase, due to rapidly cell division (E, F)
