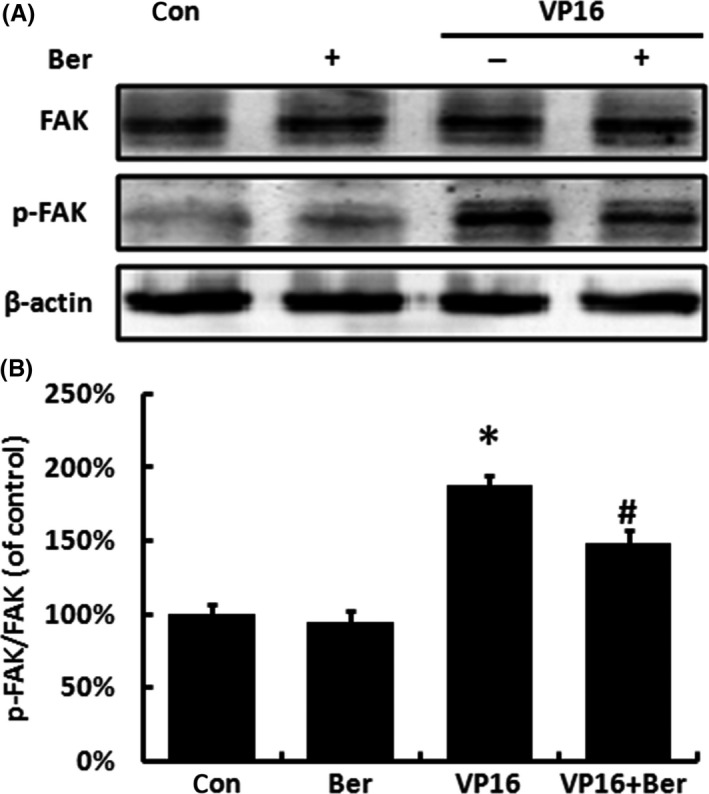
Figure 5.

The protein expression of FAK and p‐FAK of receptor cells treated by VP16 and/or Berberine within the transwell system. A, The protein expression of FAK and p‐FAK of receptor cells was measured by Western blot analysis. B, Relative quantification of p‐FAK/FAK levels expressed relative to control. Each bar represents the mean ± SD of three independent experiments, n = 3, *P < .05 compared with control; #P < .05 compared with VP16 group
