
Figure 4.
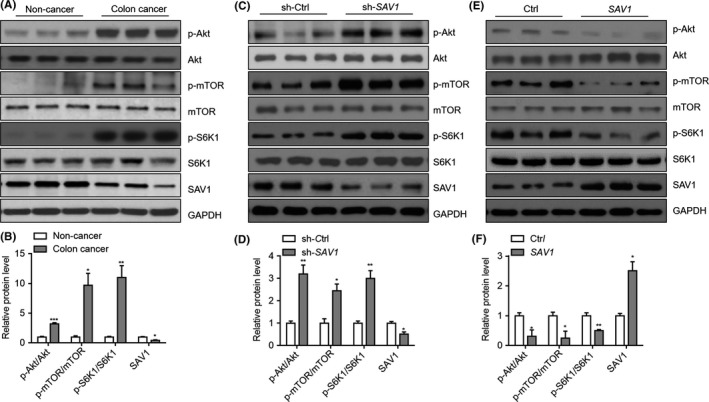
SAV1 inactivates Akt‐mTOR signalling pathway in colorectal cancer cells. A, Western blot results showing the phosphorylation of Akt, mTOR, and S6K1 in colorectal cancer tissues compared with non‐cancer tissues. B, Quantitative results of relative protein levels in (A). *P<.05, **P<.01, ***P<.001 vs non‐cancer tissues. The data were analysed by unpaired Student's t‐test. n=3 in each group. C, Western blot results showing the phosphorylation of Akt, mTOR, and S6K1 in tumour tissues with the SAV1 knockdown. DLD‐1 cells with/without SAV1 knockdown were growth in vivo in nude mice, and the tumour tissues were isolated from nude mice at the end of the experiment. The protein was harvested and subjected to Western blot analysis. D, Quantitative results of relative protein levels in (C). *P<.05, **P<.01 vs non‐cancer tissues. The data were analysed by unpaired Student's t‐test. n=3 in each group. E, Western blot results showing the Akt‐mTOR signalling pathway is inhibited in colon cancer cells with SAV1 overexpression. DLD‐1 cells with/without SAV1 overexpression were growth in vivo in nude mice, and the tumour tissues were isolated from nude mice at the end of the experiment. The protein was harvested and subjected to Western blot analysis. F, Quantitative results of relative protein levels in (C). *P<.05, **P<.01, ***P<.001 vs non‐cancer tissues. The data were analysed by unpaired Student's t‐test. n=3 in each group