
Figure 3.
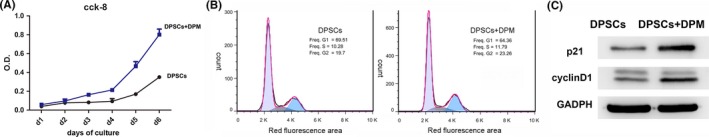
Cell proliferation analysis. DPSCs on the DPM (DPSCs+DPM group) showed a higher value of OD (A) compared with that of DPSCs on the plastic culture surface. The cell cycle analysis with PI staining of DPSCs on a plastic culture surface (DPSCs group) and DPM (DPSCs+DPM group). (B) Cyclin D1 and p21 expression at the protein level by Western blot with GAPDH serving as an internal control (C) (n=3)