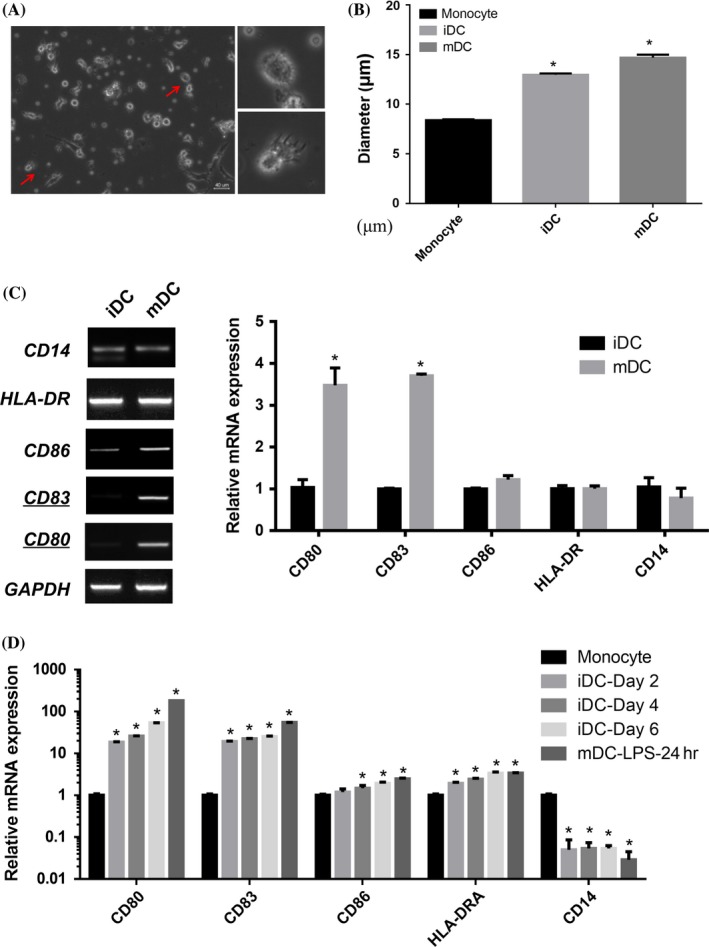
Figure 1.

Characterization of dendritic cells (DC) morphology and cell surface markers expression in different stages. (A) Cell morphology was evaluated by phase contrast microscopy. Images were captured with a Nikon Ti‐U inverted microscope, processed with Adobe Photoshop 7.0 software (Adobe, San Jose, CA; row, original magnification ×200 and ×400 respectively). Representative images are shown for the gross DC morphology. Scale bar=40 μm. (B) Monocytes cultured in the presence of GM‐CSF and IL‐4 for 6 days and then LPS for another day show clustered and protruding veils that resemble mature DCs. The diameter of cells in monocyte, iDC and mDC is measured by Scepter cell counter (n=6). Data represent the means±SEM. (C) The expression of maturation‐related markers including CD86, CD83, CD80 and HLA‐DR were all detected by PCR and qRT‐PCR. qRT‐PCR were performed in three replicates from three independent experiments (n=6). (D) iDCs generated from monocytes by incubation with GM‐CSF/IL‐4 for 6 days, then the DCs were collected on day 2, day 4 and day 6, while mDCs were treated by LPS on day 6 and collected on day 7. CD86, CD83, CD80, HLA‐DR and CD14 were detected by qRT‐PCR in different stages respectively These results are representative of one experiment out of three independent experiments. (Student's t tests; *P<.05)
