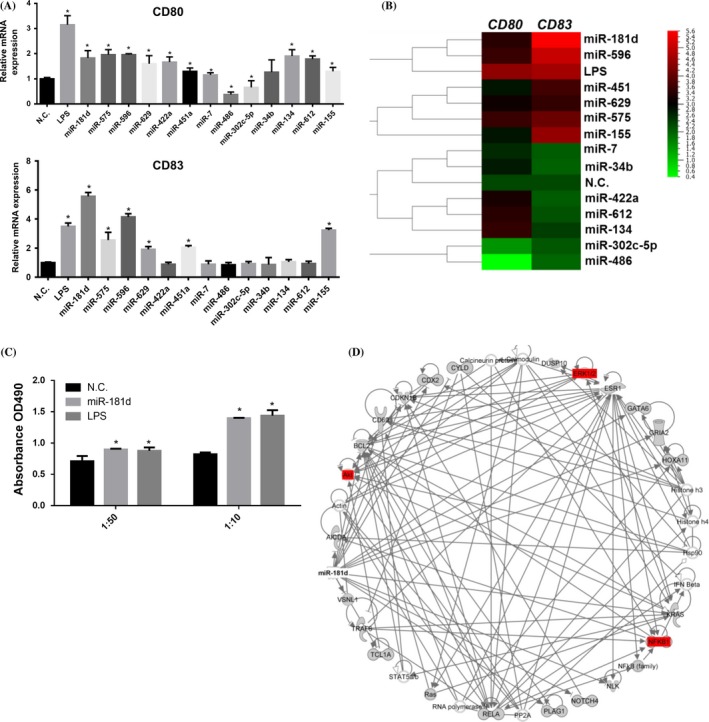
Figure 3.

miR‐181d affects the dendritic cells (DCs) maturation by regulating the expression of cell surface markers and cytokine release (A) iDCs were transfected with 12 miRNA mimics, plus miR‐155 as the positive control. CD80 and CD83 expression levels were detected by qRT‐PCR. qRT‐PCR measurements were performed in triplicate (n=3). Data represent the means±SEM. (B) Heatmap of the miRNA expression profile by Qlucore analysis (http://www.qlucore.com/). (C) DCs were cocultured with responding T cells as different ratios, 1:10 and 1:50, in 96‐well plate for 72 hours. After MTS one solution incubation, the ability of DCs to interact T cell proliferation was measuring the absorbance at 490 nm. (D) The represented network show the most highly ranked based on the IPA analysis. The genes that are blanked were determined to be highly rated in this network from the statistical analysis. A solid line represents a direct interaction between the two gene products and an arrow line means acting‐in, and the solid line ended with vertical bar means inhibition. (Student's t tests; *P<.05)
