
Figure 6.
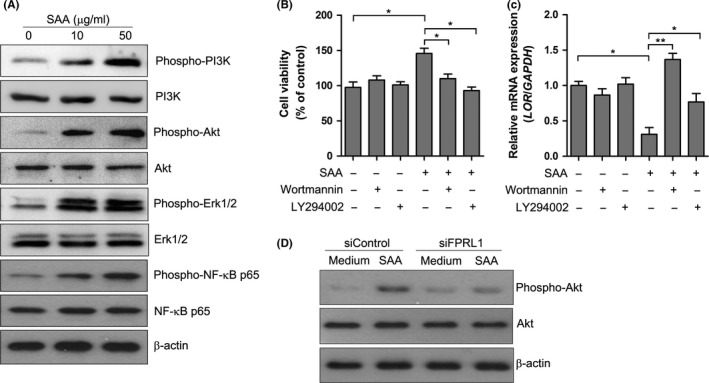
SAA activated PI3K/Akt signalling pathway. A, Keratinocytes were treated with different concentrations of SAA for 15 min, and the phosphorylation of PI3K, Akt, Erk1/2 and NF‐κB p65 was determined by Western blot. β‐actin was used for the verification of equal protein loading in each lane. Representative blots of three independent experiments are shown. B, Keratinocytes were pre‐treated with Wortmannin (100 nmol/L) or LY294002 (50 μmol/L) before the addition of SAA (20 μg/mL). After 72 h of incubation, the cell viability was evaluated with a CCK‐8 assay. C, The LOR mRNA level was measured by real‐time PCR. The data from (B and C) represent the mean ± SEM of three experiments with similar results (*P<.05, **P<.01, one‐way ANOVA). (D) The siRNA‐transfected keratinocytes were treated with SAA for 15 min, and the phosphorylation of Akt was analysed by Western blot. Representative blots of three independent experiments are shown