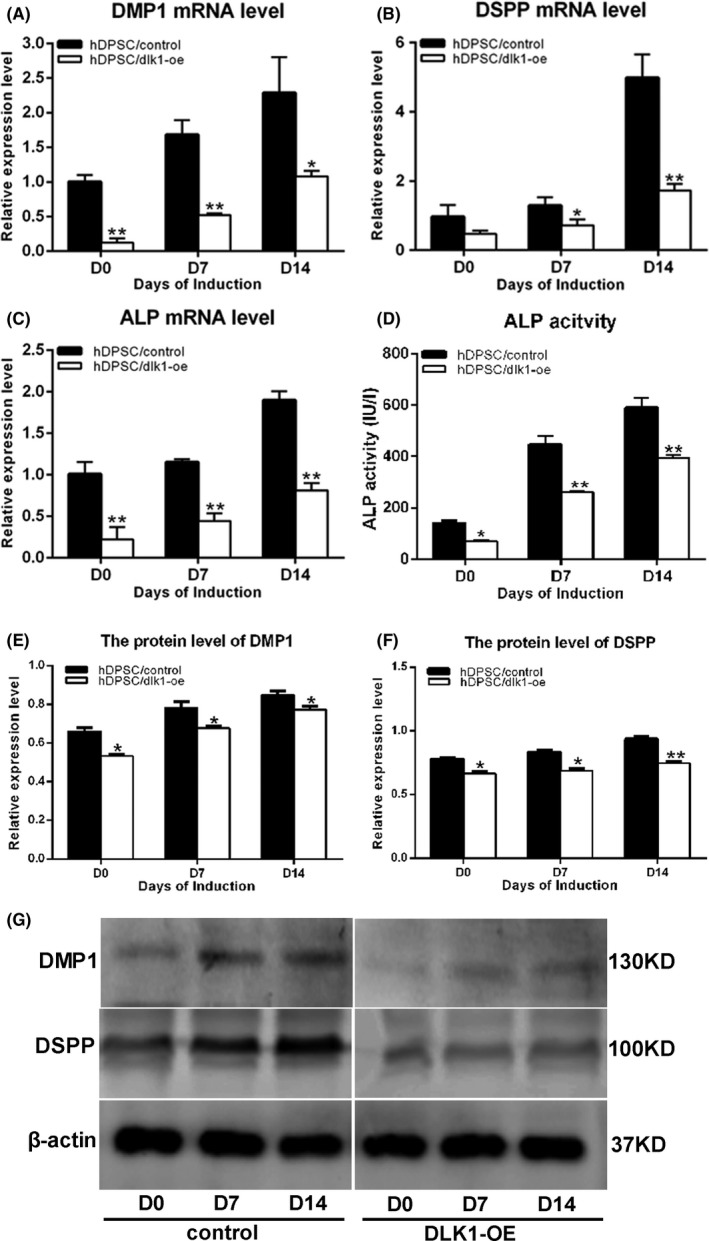
Figure 7.

The inhibition effect of DLK1 on the odontoblastic differentiation of hDPSCs. A, B and C represent the mRNA level of DMP1, DSPP and ALP after DLK1 overexpression in hDPSCs during the odontoblastic differentiation. D shows the ALP activity after DLK1 overexpression. G shows the protein level of DMP1 and DSPP by Western blot analysis. E and F show the quantified protein level of DMP1 and DSPP relative to β‐actin during the induction according to Western blots. All the data represent the mean±SD of three independent experiments
