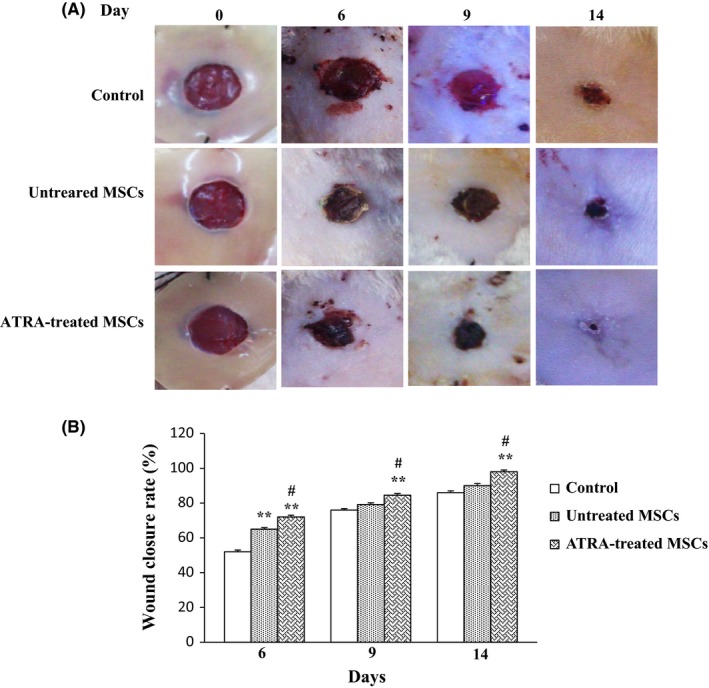
Figure 6.

Effects of MSC on wound closure. A, Images of wounds injected with PBS, untreated MSCs and ATRA‐treated MSCs after 0, 6, 9 and 14 days. B, Representation of average wound closure rate in all groups using NIH ImageJ software. Data are reported as mean±SEM. (n=3; *P<.05, **P<.01 vs control, # P<.05 vs untreated MSCs)
