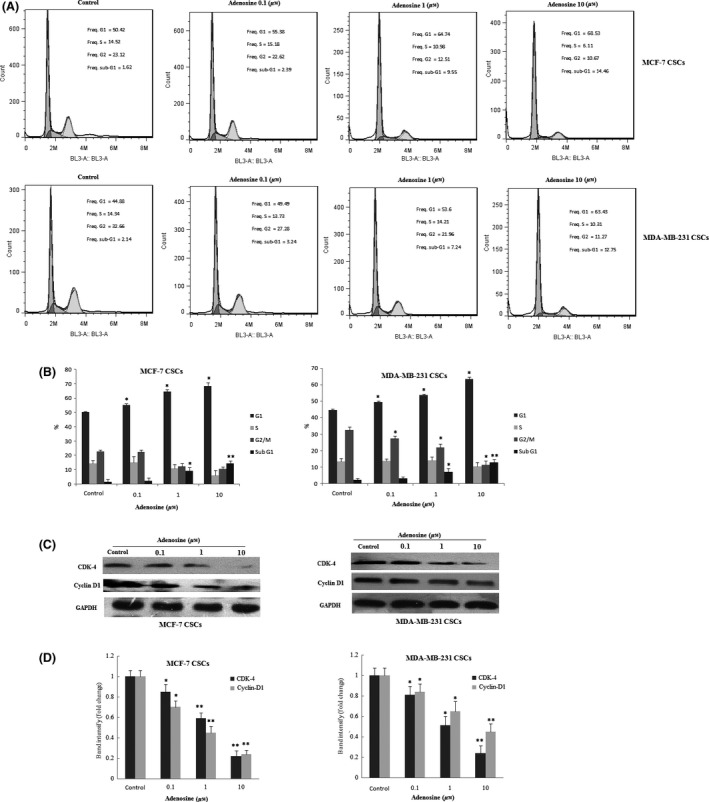
Figure 4.

Cell cycle effects of adenosine on breast cancer stem cells (CSCs). Cell cycle analysis was performed by flow cytometry (A). Cell cycle distribution was shown in breast CSCs (B). The expression levels of CDK‐4 and cyclin D1 were determined by Western blot (C). Quantification analysis of CDK‐4 and cyclin D1 protein expression (D). The results shown represent the mean ± SD of three independent experiments. *P<.05; **P<.01 compared with the control group
