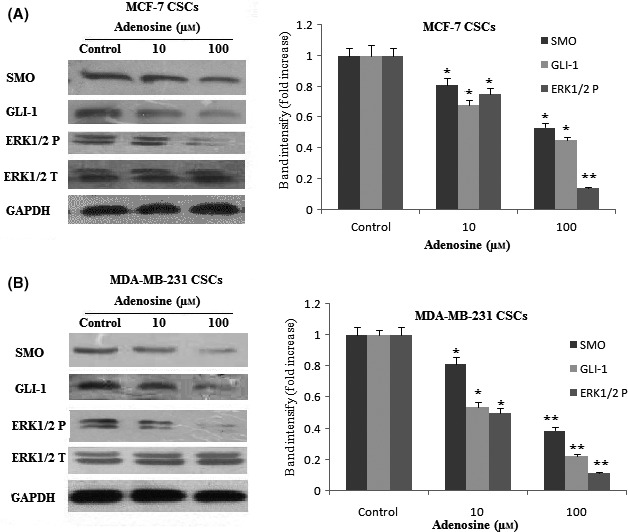
Figure 7.

The expression levels and of SMO, GLI‐1 and ERK1/2 protein after treatment with adenosine. The expression levels and quantification analysis of SMO, GLI1 and ERK1/2 proteins were determined by Western blot and imageJ software, respectively, in MCF‐7 CSCs (A) and MDA‐MB‐231 CSCs (B). The results shown represent the mean ± SD of three independent experiments. *P<.05; **P<.01 compared with the control group
