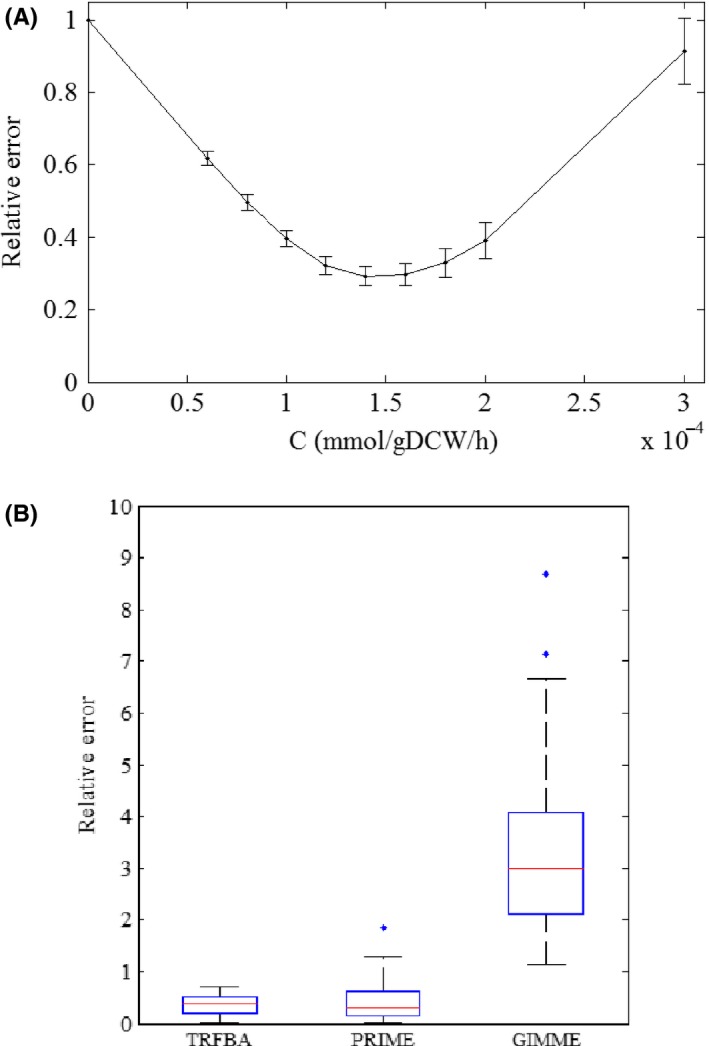
Figure 2.

A) Sensitivity of the error with respect to the C values using NCI‐60 data set (Each average error and its variation represent the error distribution across all cell lines and the error bars represent the standard error of the mean) and B) Distribution of the relative error to predict growth rates of NCI‐60 cell lines (Each box plot represents the distribution of error for all NCI‐60 cell lines)
