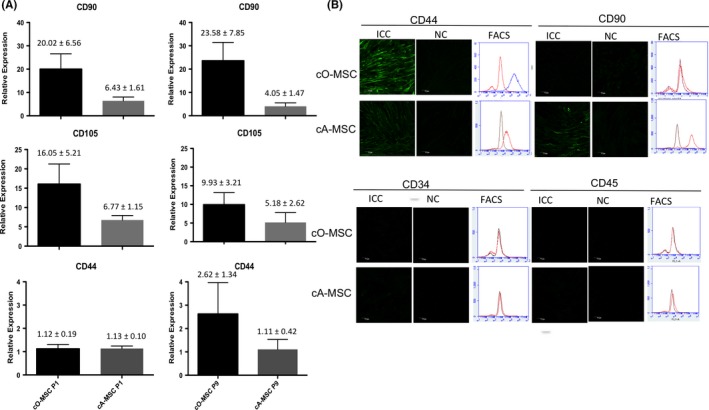
Figure 2.

Mesenchymal markers in ovarian‐ and adipose‐derived mesenchymal stem cell (MSC). (A) Relative expression of MSC‐specific marker genes CD44,CD90 and CD105 in ovarian (cO‐MSC)‐ and adipose (cA‐MSC)‐derived cells at first (P1) and ninth (P9) passages. (B) Protein analysis by immunocytochemistry (ICC), negative control (NC) and flow cytometry (FACS) in cO‐MSC and cA‐MSC of mesenchymal cell markers (CD44 and CD90) and hematopoietic markers (CD34 and CD45). Scale bars = 70 μm
