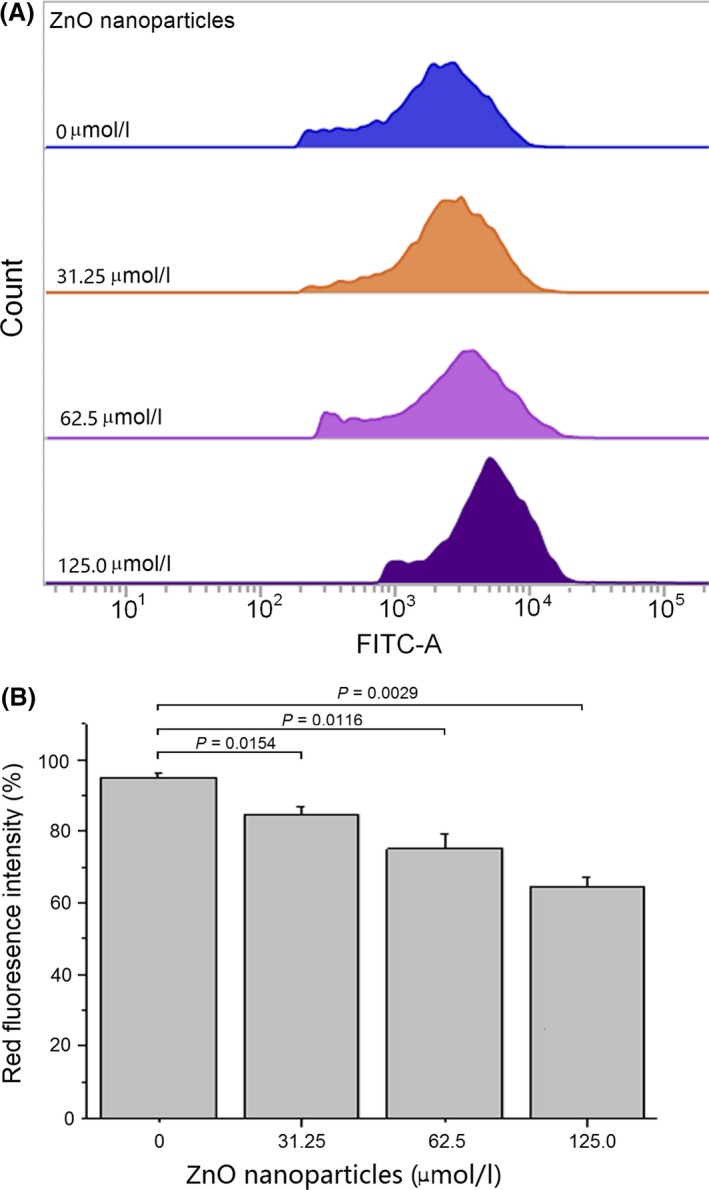
Figure 3.

Alterations of mitochondrial membrane potential (Δφm) in murine photoreceptor cells after treatment with different concentrations of zinc oxide (ZnO) nanoparticles for 6 h. Red fluorescence represents the J‐aggregates and indicates the degree of integrity of mitochondrial membrane in living cells. (A) Diagrams obtained from flow cytometry; (B) result of histogram analysis. Data are from three independent experiments performed by flow cytometry
