
Figure 3.
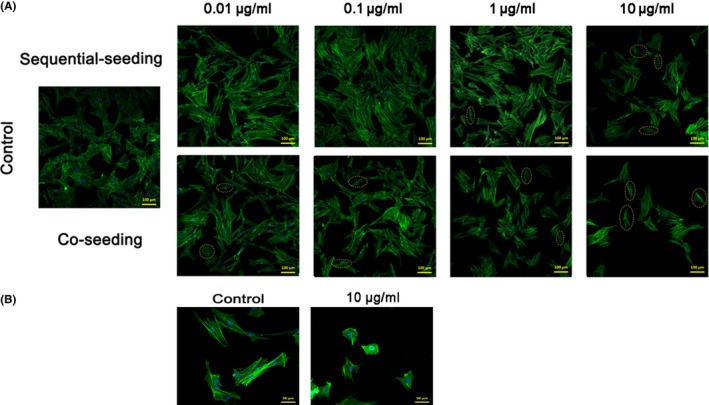
Adhesion density of bone marrow‐derived mesenchymal stem cells (BMSCs) that were sequentially seeded and co‐seeded into GO/DMEM at concentrations of 0.01~10 μg/mL and morphology of BMSCs treated with/without GO. (A) Confocal laser scanning images of BMSCs at low magnification show adhesion density after 72 h of incubation. The control group had no pristine GO nanosheets. Sample cells with abnormal morphology are circled with a dashed yellow line. (B) The high‐magnification images show the morphology of BMSCs after 72 h of incubation with and without pristine GO nanosheets. Blue stains nuclei and green stains cytoskeleton