
Figure 3.
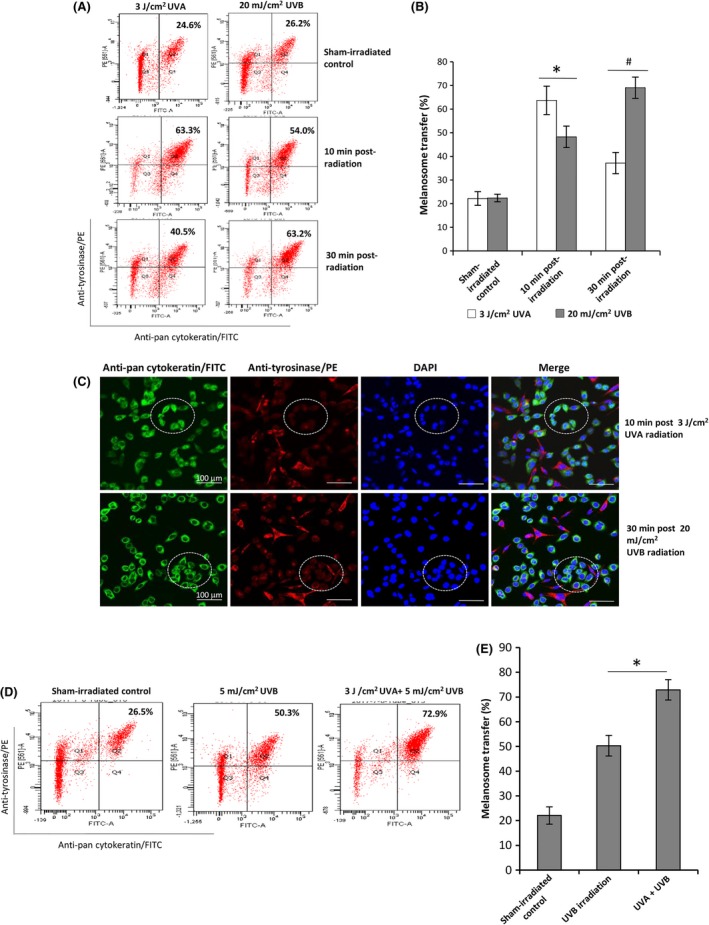
Induction of melanosome transfer in MC‐KC co‐culture by UVA or UVB. Co‐cultures of MCs and KCs at a ratio of 1:20 were established and then exposed to 3 J/cm2 UVA or 20 mJ/cm2 UVB irradiation (A‐C). The cell co‐culture plates wrapped with aluminium foil were used for sham‐irradiated control. After 10 or 30 min of post‐irradiation, the cells in co‐cultures were harvested for flow cytometry analyses, as described in the Figure 1. Meanwhile, the co‐cultured cells were exposed to 5 mJ/cm2 UVB or were sequentially exposed to 3 J/cm2 UVA and 5 mJ/cm2 UVB. After 30 min post‐irradiation, the cells were harvested for flow cytometry analysis. Representative fluorescence dot‐plots from flow cytometry analyses are shown in (A and D). Representative images of melanosome transfer are shown in the middle panel (C). The white circled areas in the images indicate melanosome uptake by KCs. Bar graphs (B and E) show the means ± SEM of melanosome transfer efficiency from three independent experiments. *P < .05, # P < .01