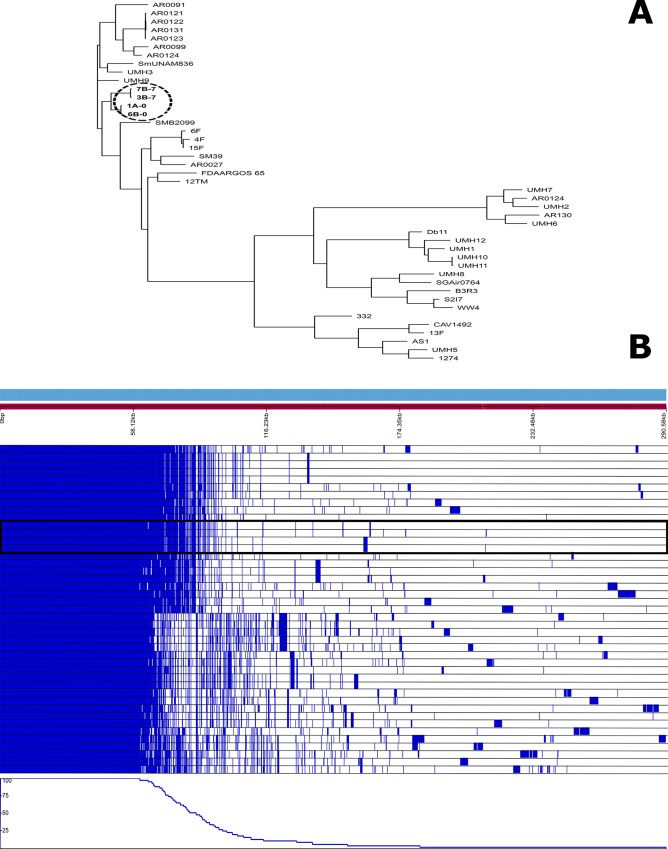
Fig 6.
Phylogenic representation of the 4 S.marcescens genomes sequenced in this study and comparison with other 32 public S. marcescens genomes (A). The second part of the figure (B) represents the common core of all 36 genomes versus the isolate-specific genes. Our 4 isolates grouped together in both analysis and are marked.

