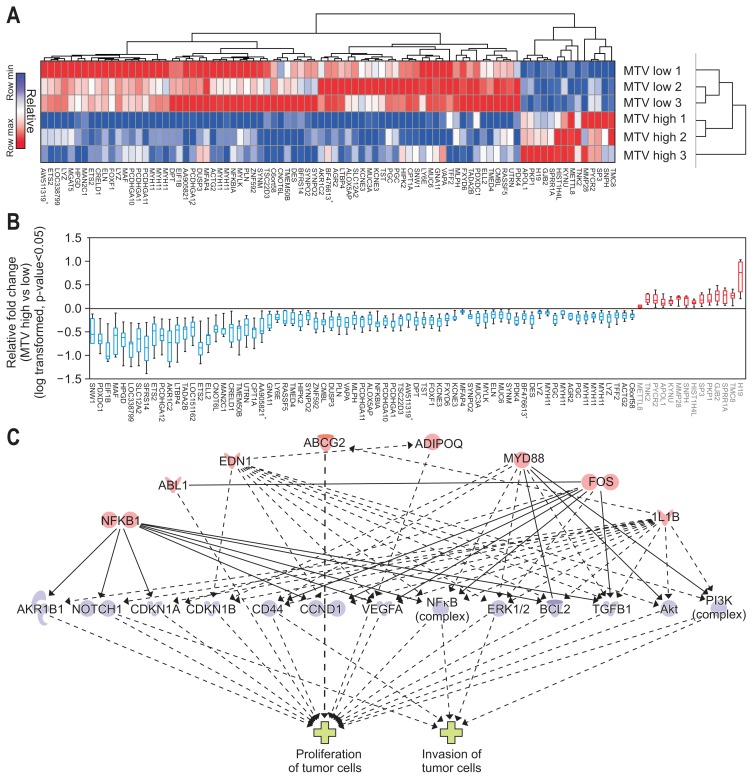
Fig. 5.
Hierarchical clustering & significant genes heat map comparing metabolic tumor volume (MTV) high versus low (14 upregulated genes and 71 downregulated genes). (A) Hierarchical clustering of significantly expressed genes (fold change >2 or <0.5 with p<0.05). (B) Relative log-transformed fold changes of MTV high versus low. (C) Causative analysis of regulatory effectors and associated tumor phenotype. Master regulators (NFKB1, ABL1, EDN1, ABCG2, ADIPOQ, MYD88, FOS, and IL1B) were associated with the tumor phenotype in terms of the proliferation and invasion of tumor cells via several downstream effectors (AKR1B1, NOTCH1, CDKN1A, CDKN1B, CD44, CCND1, VEGFA, NFkB, ERK1/2, BCL2, TGFB1, Akt, and PI3K) (data shown in Supplementary Tables 4 and 6).

