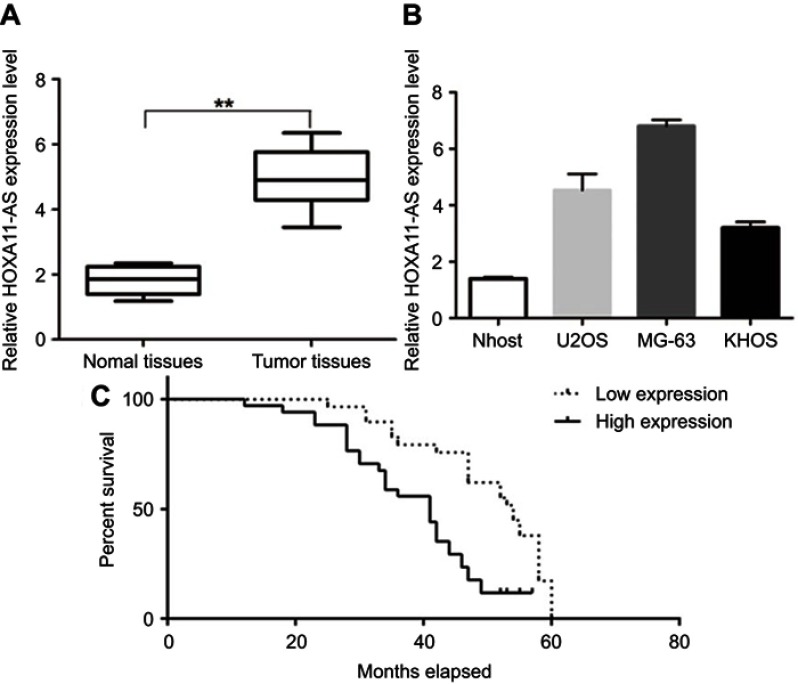
Figure 1.
RT-PCR results of HOXA11-AS expression in OS tissues and cell lines. (A) The expression level of HOXA11-AS in tumor tissues and the adjacent tissues (**P<0.01, n=61); (B) HOXA11-AS expression level in OS cell lines and normal human osteoblasts (*P<0.05); (C) The Kaplan–Meier curves by HOXA11-AS expression levels. Patients with high HOXA11-AS expression had a poor overall survival compared to those patients with low HOXA11-AS expression (log-rank test; P=0.007) (n=61).

